
- Startseite >
- Meteorologie >
- Luftdruck >
- Iller - Lech - Bodensee >
- Trauchgau >
- Jahresgrafik

Jahresgrafik Trauchgau
Luftdruck vom 01.01.2019 bis zum 31.12.2019
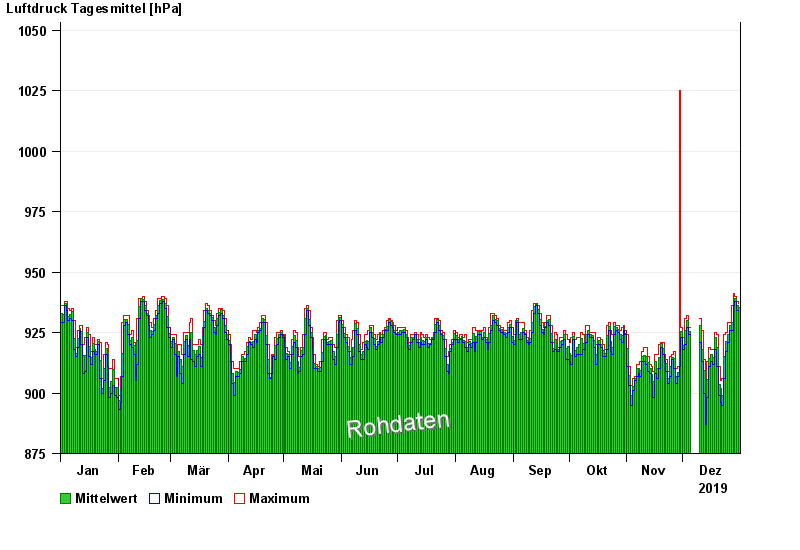
Hinweis: Die Zeitreihe im gewählten Zeitraum weist Lücken auf.
| Datum | Mittelwert [hPa] | Maximum [hPa] | Minimum [hPa] |
|---|---|---|---|
| 31.12.2019 | 935,3 | 937,0 | 934,0 |
| 30.12.2019 | 936,0 | 938,0 | 934,0 |
| 29.12.2019 | 939,0 | 940,0 | 938,0 |
| 28.12.2019 | 939,1 | 941,0 | 936,0 |
| 27.12.2019 | 929,3 | 936,0 | 926,0 |
| 26.12.2019 | 928,0 | 929,0 | 926,0 |
| 25.12.2019 | 924,3 | 929,0 | 921,0 |
© Bayerisches Landesamt für Umwelt 2024