
- Startseite >
- Meteorologie >
- Luftdruck >
- Oberer Main - Elbe >
- Rödental-Schönstädt (Speicher) >
- Jahresgrafik

Jahresgrafik Rödental-Schönstädt (Speicher)
Luftdruck vom 22.09.2022 bis zum 21.09.2023
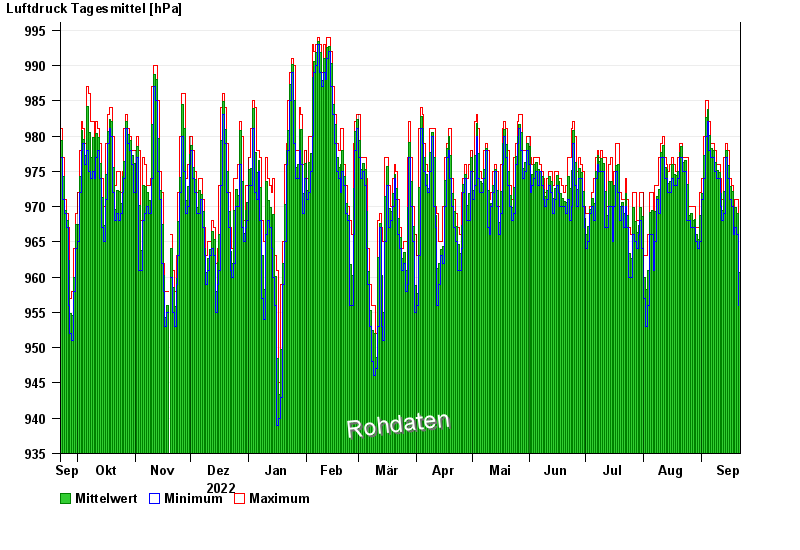
Hinweis: Die Zeitreihe im gewählten Zeitraum weist Lücken auf.
| Datum | Mittelwert [hPa] | Maximum [hPa] | Minimum [hPa] |
|---|---|---|---|
| 21.09.2023 | 960,6 | 966,0 | 956,0 |
| 20.09.2023 | 969,0 | 971,0 | 966,0 |
| 19.09.2023 | 969,8 | 971,0 | 967,0 |
| 18.09.2023 | 967,5 | 970,0 | 966,0 |
| 17.09.2023 | 972,1 | 973,0 | 970,0 |
| 16.09.2023 | 972,8 | 974,0 | 971,0 |
| 15.09.2023 | 975,8 | 978,0 | 974,0 |
© Bayerisches Landesamt für Umwelt 2024