
- Startseite >
- Meteorologie >
- Luftdruck >
- Oberer Main - Elbe >
- Rödental-Schönstädt (Speicher) >
- Jahresgrafik

Jahresgrafik Rödental-Schönstädt (Speicher)
Luftdruck vom 04.12.2021 bis zum 03.12.2022
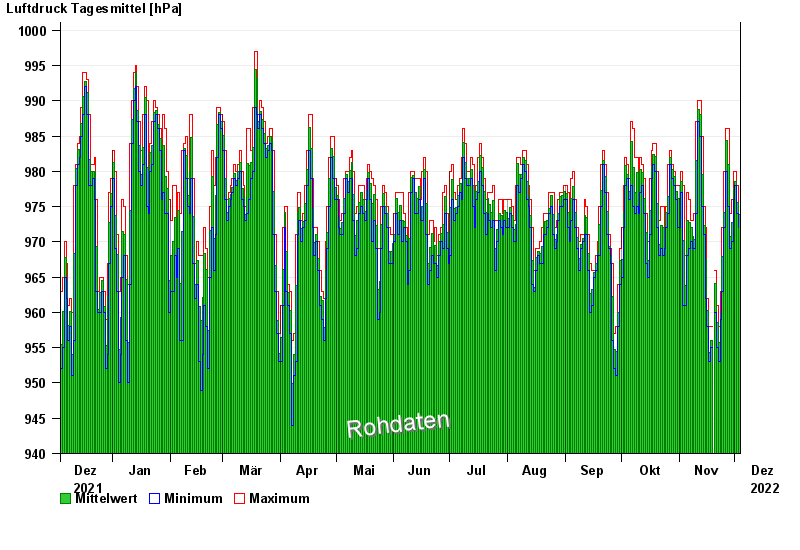
Hinweis: Die Zeitreihe im gewählten Zeitraum weist Lücken auf.
| Datum | Mittelwert [hPa] | Maximum [hPa] | Minimum [hPa] |
|---|---|---|---|
| 03.12.2022 | 973,9 | 975,0 | 972,0 |
| 02.12.2022 | 975,6 | 978,0 | 974,0 |
| 01.12.2022 | 978,6 | 980,0 | 978,0 |
| 30.11.2022 | 977,4 | 980,0 | 976,0 |
| 29.11.2022 | 972,8 | 976,0 | 970,0 |
| 28.11.2022 | 970,8 | 974,0 | 969,0 |
| 27.11.2022 | 981,0 | 986,0 | 975,0 |
© Bayerisches Landesamt für Umwelt 2024