
- Startseite >
- Meteorologie >
- Luftdruck >
- Oberer Main - Elbe >
- Mauthaus (Klimastation) >
- Jahresgrafik

Jahresgrafik Mauthaus (Klimastation)
Luftdruck vom 28.05.2022 bis zum 27.05.2023
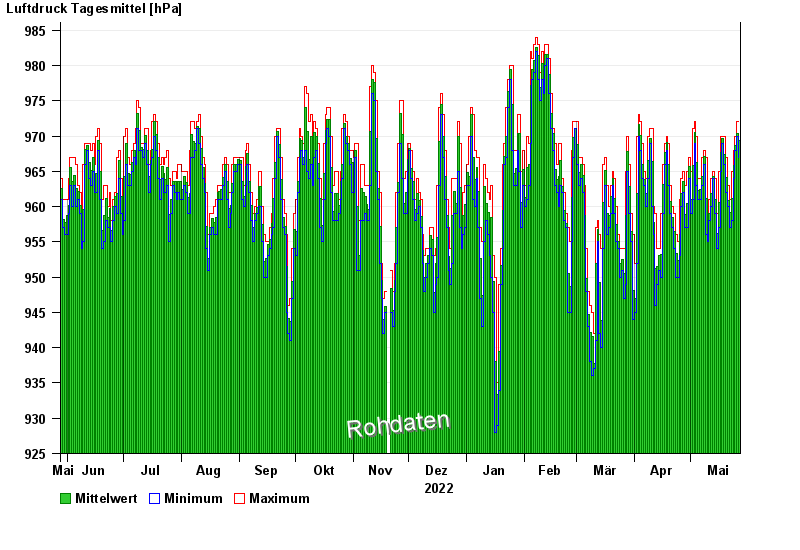
Hinweis: Die Zeitreihe im gewählten Zeitraum weist Lücken auf.
| Datum | Mittelwert [hPa] | Maximum [hPa] | Minimum [hPa] |
|---|---|---|---|
| 27.05.2023 | 969,4 | 972,0 | 967,0 |
| 26.05.2023 | 970,3 | 972,0 | 970,0 |
| 25.05.2023 | 968,7 | 970,0 | 968,0 |
| 24.05.2023 | 965,8 | 968,0 | 964,0 |
| 23.05.2023 | 961,2 | 965,0 | 958,0 |
| 22.05.2023 | 959,2 | 961,0 | 957,0 |
| 21.05.2023 | 960,8 | 963,0 | 960,0 |
© Bayerisches Landesamt für Umwelt 2024