
- Startseite >
- Meteorologie >
- Luftdruck >
- Oberer Main - Elbe >
- Mauthaus (Klimastation) >
- Jahresgrafik

Jahresgrafik Mauthaus (Klimastation)
Luftdruck vom 24.04.2021 bis zum 23.04.2022
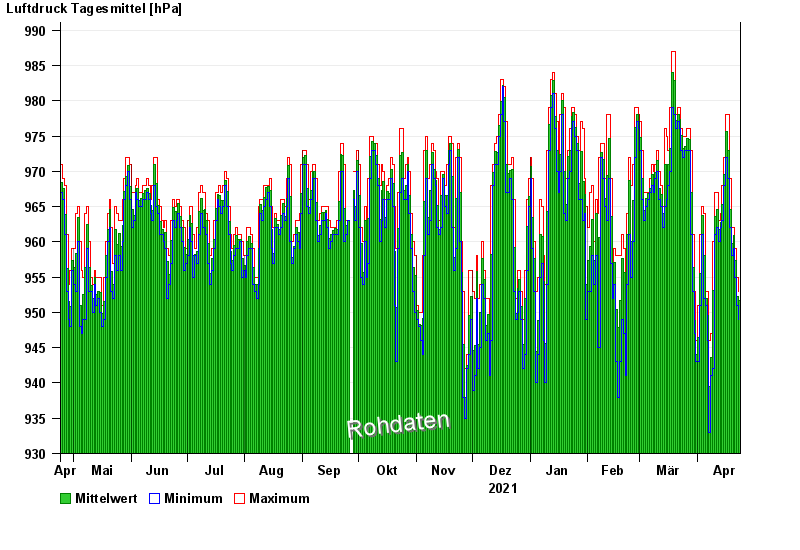
Hinweis: Die Zeitreihe im gewählten Zeitraum weist Lücken auf.
| Datum | Mittelwert [hPa] | Maximum [hPa] | Minimum [hPa] |
|---|---|---|---|
| 23.04.2022 | 951,7 | 953,0 | 949,0 |
| 22.04.2022 | 952,3 | 955,0 | 951,0 |
| 21.04.2022 | 957,3 | 959,0 | 955,0 |
| 20.04.2022 | 960,9 | 962,0 | 959,0 |
| 19.04.2022 | 959,7 | 962,0 | 958,0 |
| 18.04.2022 | 964,6 | 969,0 | 962,0 |
| 17.04.2022 | 972,9 | 978,0 | 969,0 |
© Bayerisches Landesamt für Umwelt 2024