
- Startseite >
- Meteorologie >
- Luftdruck >
- Bayern >
- Tegelberg 1710m >
- Jahresgrafik

Jahresgrafik Tegelberg 1710m
Luftdruck vom 27.08.2007 bis zum 26.08.2008
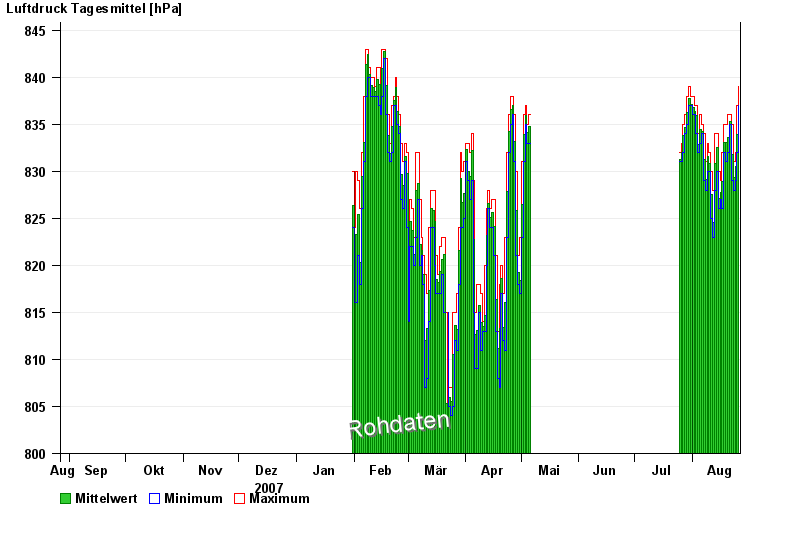
Hinweis: Die Zeitreihe im gewählten Zeitraum weist Lücken auf.
| Datum | Mittelwert [hPa] | Maximum [hPa] | Minimum [hPa] |
|---|---|---|---|
| 26.08.2008 | 838,2 | 839,0 | 837,0 |
| 25.08.2008 | 833,9 | 837,0 | 832,0 |
| 24.08.2008 | 830,6 | 832,0 | 829,0 |
| 23.08.2008 | 829,3 | 831,0 | 828,0 |
| 22.08.2008 | 831,8 | 835,0 | 829,0 |
| 21.08.2008 | 835,3 | 836,0 | 835,0 |
| 20.08.2008 | 833,6 | 836,0 | 832,0 |
© Bayerisches Landesamt für Umwelt 2024