
- Startseite >
- Flüsse >
- Wassertemperatur >
- Untere Donau >
- Pulling >
- Jahresgrafik

Jahresgrafik Pulling / Regen
Wassertemperatur vom 28.01.2022 bis zum 27.01.2023
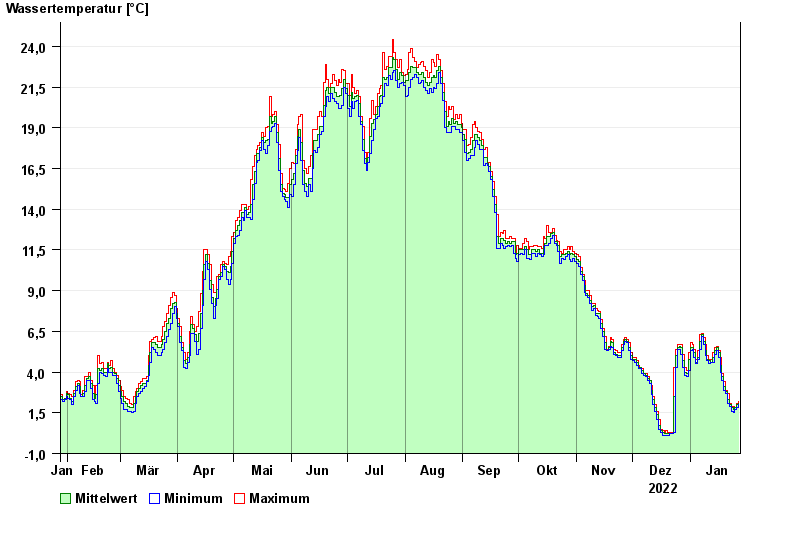
| Datum | Wassertemperatur [°C] | Maximum [°C] | Minimum [°C] |
|---|---|---|---|
| 27.01.2023 | 2,1 | 2,2 | 2,0 |
| 26.01.2023 | 2,0 | 2,1 | 1,8 |
| 25.01.2023 | 1,8 | 1,8 | 1,7 |
| 24.01.2023 | 1,7 | 1,9 | 1,5 |
| 23.01.2023 | 1,8 | 1,9 | 1,6 |
| 22.01.2023 | 2,0 | 2,1 | 1,9 |
| 21.01.2023 | 2,3 | 2,7 | 2,1 |
© Bayerisches Landesamt für Umwelt 2024