
- Startseite >
- Flüsse >
- Wassertemperatur >
- Naab - Regen >
- Erbendorf >
- Jahresgrafik

Jahresgrafik Erbendorf / Fichtelnaab
Wassertemperatur vom 13.05.2021 bis zum 12.05.2022
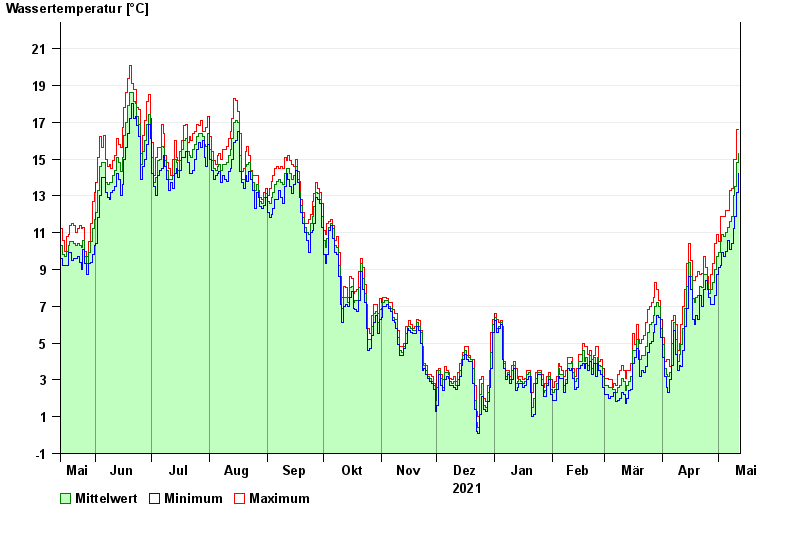
| Datum | Wassertemperatur [°C] | Maximum [°C] | Minimum [°C] |
|---|---|---|---|
| 12.05.2022 | 15,3 | 16,6 | 14,2 |
| 11.05.2022 | 14,8 | 16,6 | 13,2 |
| 10.05.2022 | 13,5 | 15,0 | 11,9 |
| 09.05.2022 | 13,0 | 15,0 | 11,2 |
| 08.05.2022 | 11,9 | 13,4 | 10,4 |
| 07.05.2022 | 11,6 | 13,3 | 10,1 |
| 06.05.2022 | 11,3 | 12,2 | 10,6 |
© Bayerisches Landesamt für Umwelt 2024