
- Startseite >
- Flüsse >
- Wassertemperatur >
- Unterer Main >
- Astheim >
- Jahresgrafik

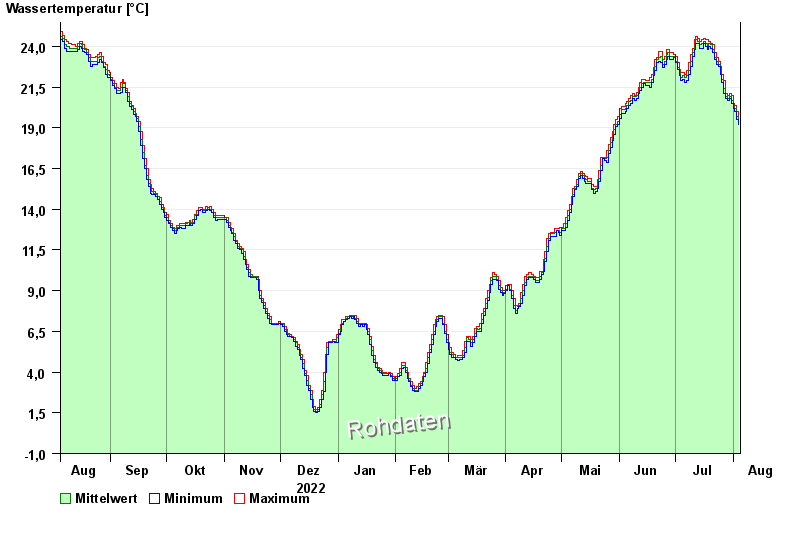
Jahresgrafik Astheim / Main
Wassertemperatur vom 05.08.2022 bis zum 04.08.2023
| Datum | Wassertemperatur [°C] | Maximum [°C] | Minimum [°C] |
|---|---|---|---|
| 04.08.2023 | 19,3 | 19,5 | 19,2 |
| 03.08.2023 | 19,7 | 20,0 | 19,5 |
| 02.08.2023 | 20,2 | 20,4 | 20,0 |
| 01.08.2023 | 20,4 | 20,5 | 20,2 |
| 31.07.2023 | 20,7 | 21,0 | 20,5 |
| 30.07.2023 | 20,9 | 21,1 | 20,8 |
| 29.07.2023 | 20,8 | 21,0 | 20,7 |
© Bayerisches Landesamt für Umwelt 2024