
- Startseite >
- Flüsse >
- Wassertemperatur >
- Isar >
- Eschenlohe Brücke >
- Jahresgrafik

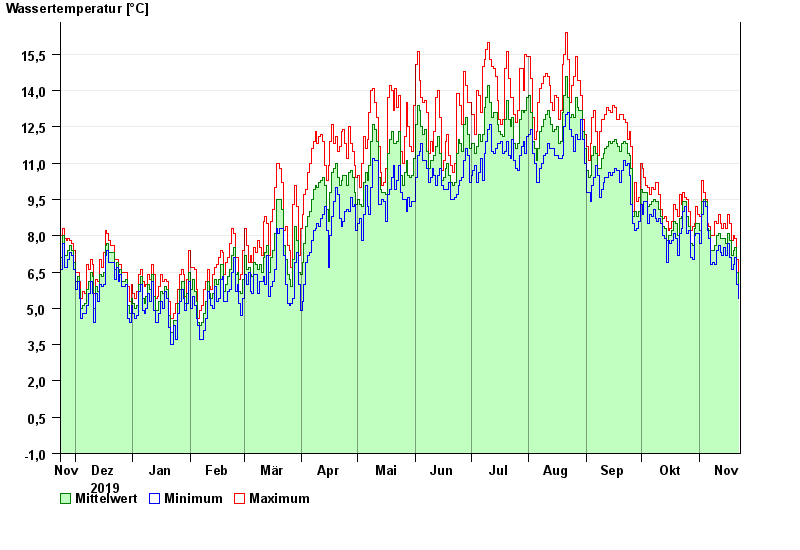
Jahresgrafik Eschenlohe Brücke / Loisach
Wassertemperatur vom 23.11.2019 bis zum 22.11.2020
| Datum | Wassertemperatur [°C] | Maximum [°C] | Minimum [°C] |
|---|---|---|---|
| 22.11.2020 | 5,9 | 6,4 | 5,4 |
| 21.11.2020 | 6,5 | 7,0 | 6,0 |
| 20.11.2020 | 7,5 | 7,9 | 7,1 |
| 19.11.2020 | 7,4 | 8,0 | 6,8 |
| 18.11.2020 | 7,2 | 7,8 | 6,6 |
| 17.11.2020 | 7,8 | 8,5 | 7,1 |
| 16.11.2020 | 8,1 | 8,9 | 7,7 |
© Bayerisches Landesamt für Umwelt 2024