
- Startseite >
- Flüsse >
- Wassertemperatur >
- Iller - Lech - Bodensee >
- Unterthingau >
- Jahresgrafik

Jahresgrafik Unterthingau / Kirnach
Wassertemperatur vom 04.08.2021 bis zum 03.08.2022
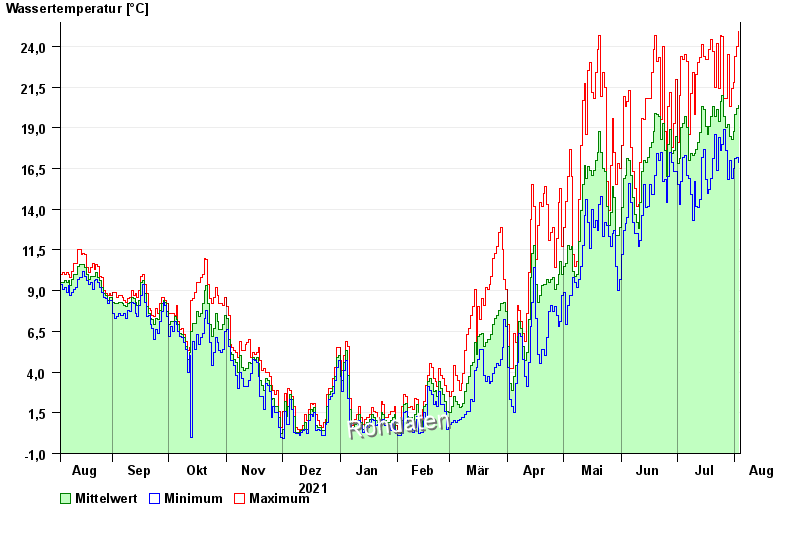
| Datum | Wassertemperatur [°C] | Maximum [°C] | Minimum [°C] |
|---|---|---|---|
| 03.08.2022 | 20,4 | 24,9 | 16,9 |
| 02.08.2022 | 20,2 | 24,0 | 17,2 |
| 01.08.2022 | 19,8 | 23,4 | 17,1 |
| 31.07.2022 | 18,8 | 21,8 | 16,5 |
| 30.07.2022 | 18,3 | 21,4 | 15,9 |
| 29.07.2022 | 18,5 | 20,3 | 17,0 |
| 28.07.2022 | 19,2 | 23,5 | 15,8 |
© Bayerisches Landesamt für Umwelt 2024