
- Startseite >
- Flüsse >
- Wasserstand >
- Regnitz >
- Trunstadt >
- Jahresgrafik

Jahresgrafik Trunstadt / Main
Wasserstand vom 08.03.2021 bis zum 07.03.2022
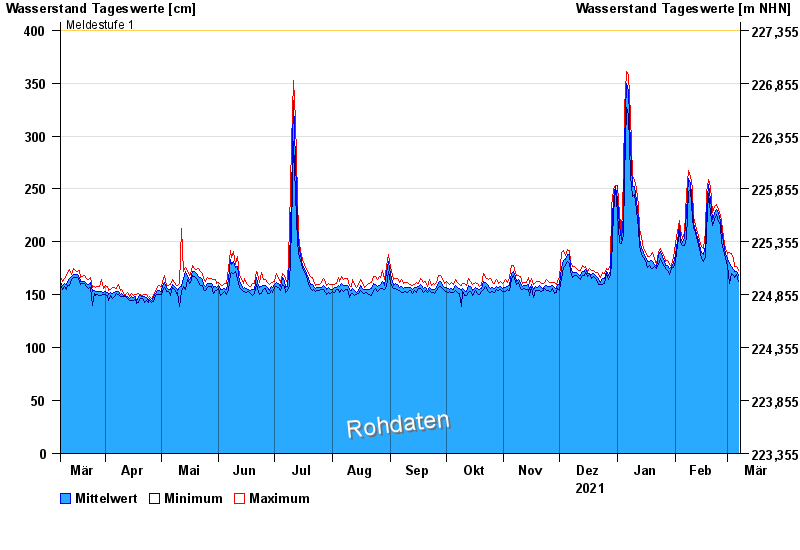
- Meldestufe 1 400 cm
- Meldestufe 2 450 cm
- Meldestufe 3 600 cm
- Meldestufe 4 700 cm
- Hochwassergefahrenfläche HQ100 790 cm
| Datum | Mittelwert [cm] | Maximum [cm] | Minimum [cm] |
|---|---|---|---|
| 07.03.2022 | 168 | 173 | 163 |
| 06.03.2022 | 172 | 177 | 169 |
| 05.03.2022 | 172 | 177 | 166 |
| 04.03.2022 | 174 | 184 | 168 |
| 03.03.2022 | 177 | 189 | 170 |
| 02.03.2022 | 180 | 190 | 161 |
| 01.03.2022 | 184 | 189 | 178 |
© Bayerisches Landesamt für Umwelt 2024