
- Startseite >
- Flüsse >
- Wasserstand >
- Regnitz >
- Schnaittach Markt >
- Jahresgrafik

Jahresgrafik Schnaittach Markt / Schnaittach
Wasserstand vom 18.01.2021 bis zum 17.01.2022
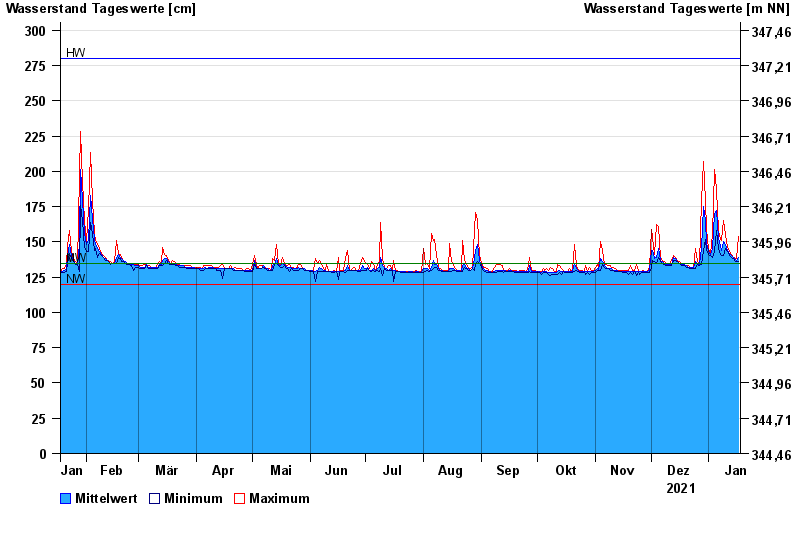
| Datum | Mittelwert [cm] | Maximum [cm] | Minimum [cm] |
|---|---|---|---|
| 17.01.2022 | 139 | 154 | 136 |
| 16.01.2022 | 137 | 138 | 136 |
| 15.01.2022 | 138 | 139 | 137 |
| 14.01.2022 | 139 | 139 | 138 |
| 13.01.2022 | 140 | 141 | 139 |
| 12.01.2022 | 142 | 143 | 140 |
| 11.01.2022 | 144 | 146 | 143 |
© Bayerisches Landesamt für Umwelt 2024