
- Startseite >
- Flüsse >
- Wasserstand >
- Regnitz >
- Schnaittach Markt >
- Jahresgrafik

Jahresgrafik Schnaittach Markt / Schnaittach
Wasserstand vom 05.12.2021 bis zum 04.12.2022
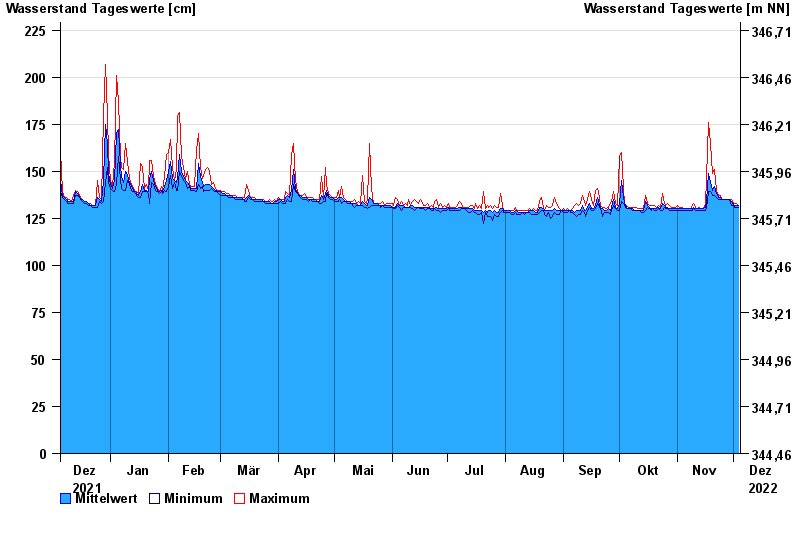
| Datum | Mittelwert [cm] | Maximum [cm] | Minimum [cm] |
|---|---|---|---|
| 04.12.2022 | 132 | 132 | 131 |
| 03.12.2022 | 132 | 133 | 131 |
| 02.12.2022 | 132 | 133 | 131 |
| 01.12.2022 | 132 | 133 | 132 |
| 30.11.2022 | 134 | 135 | 132 |
| 29.11.2022 | 135 | 135 | 135 |
| 28.11.2022 | 135 | 135 | 135 |
© Bayerisches Landesamt für Umwelt 2024