
- Startseite >
- Flüsse >
- Wasserstand >
- Regnitz >
- Schnaittach Markt >
- Jahresgrafik

Jahresgrafik Schnaittach Markt / Schnaittach
Wasserstand vom 01.01.2022 bis zum 31.12.2022
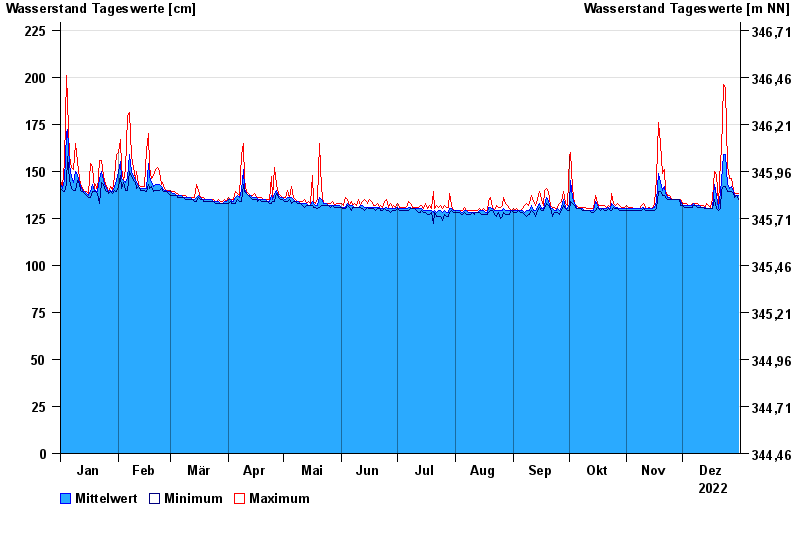
| Datum | Mittelwert [cm] | Maximum [cm] | Minimum [cm] |
|---|---|---|---|
| 31.12.2022 | 137 | 138 | 135 |
| 30.12.2022 | 137 | 138 | 137 |
| 29.12.2022 | 137 | 138 | 136 |
| 28.12.2022 | 139 | 140 | 138 |
| 27.12.2022 | 142 | 146 | 139 |
| 26.12.2022 | 141 | 146 | 139 |
| 25.12.2022 | 143 | 153 | 139 |
© Bayerisches Landesamt für Umwelt 2024