
- Startseite >
- Flüsse >
- Wasserstand >
- Regnitz >
- Schnaittach Markt >
- Jahresgrafik

Jahresgrafik Schnaittach Markt / Schnaittach
Wasserstand vom 01.01.2024 bis zum 25.04.2024
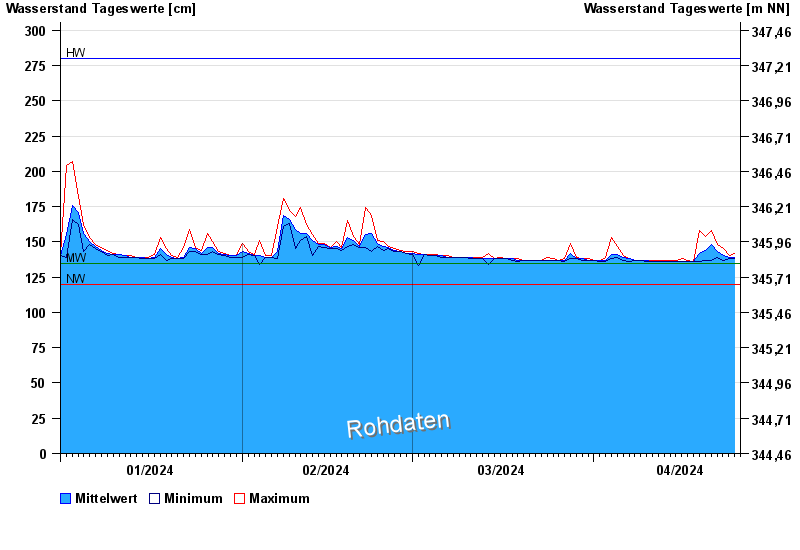
| Datum | Mittelwert [cm] | Maximum [cm] | Minimum [cm] |
|---|---|---|---|
| 25.04.2024 | 139 | 140 | 138 |
| 24.04.2024 | 139 | 140 | 138 |
| 23.04.2024 | 140 | 145 | 137 |
| 22.04.2024 | 143 | 148 | 139 |
| 21.04.2024 | 148 | 158 | 137 |
| 20.04.2024 | 144 | 154 | 137 |
| 19.04.2024 | 142 | 158 | 136 |
© Bayerisches Landesamt für Umwelt 2024