
- Startseite >
- Flüsse >
- Wasserstand >
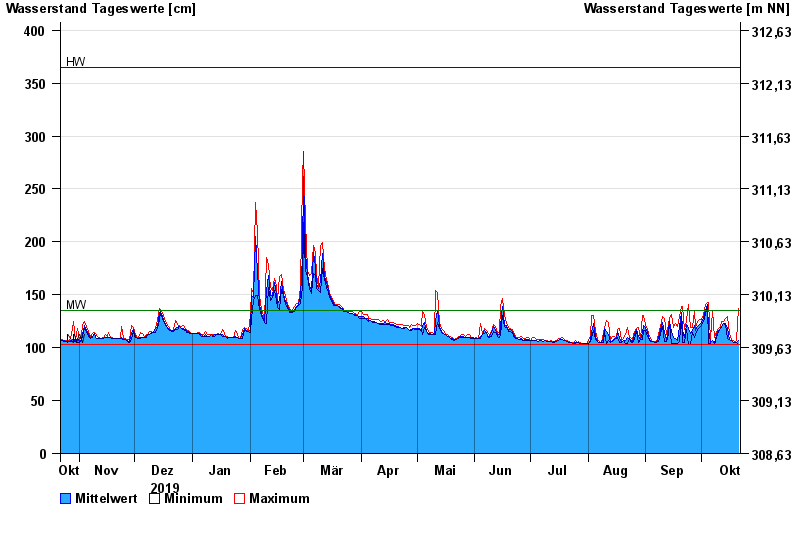
- Regnitz >
- Illesheim >
- Jahresgrafik

Jahresgrafik Illesheim / Aisch
Wasserstand vom 22.10.2019 bis zum 21.10.2020
Hinweis
Wasserstand und Abfluss wird zeitweise durch Biberdamm beeinflusst.
| Datum | Mittelwert [cm] | Maximum [cm] | Minimum [cm] |
|---|---|---|---|
| 21.10.2020 | 107 | 137 | 103 |
| 20.10.2020 | 105 | 107 | 105 |
| 19.10.2020 | 105 | 106 | 105 |
| 18.10.2020 | 105 | 107 | 105 |
| 17.10.2020 | 107 | 108 | 107 |
| 16.10.2020 | 108 | 113 | 108 |
| 15.10.2020 | 118 | 129 | 109 |
© Bayerisches Landesamt für Umwelt 2024