
- Startseite >
- Flüsse >
- Wasserstand >
- Regnitz >
- Illesheim >
- Jahresgrafik

Jahresgrafik Illesheim / Aisch
Wasserstand vom 20.05.2022 bis zum 19.05.2023
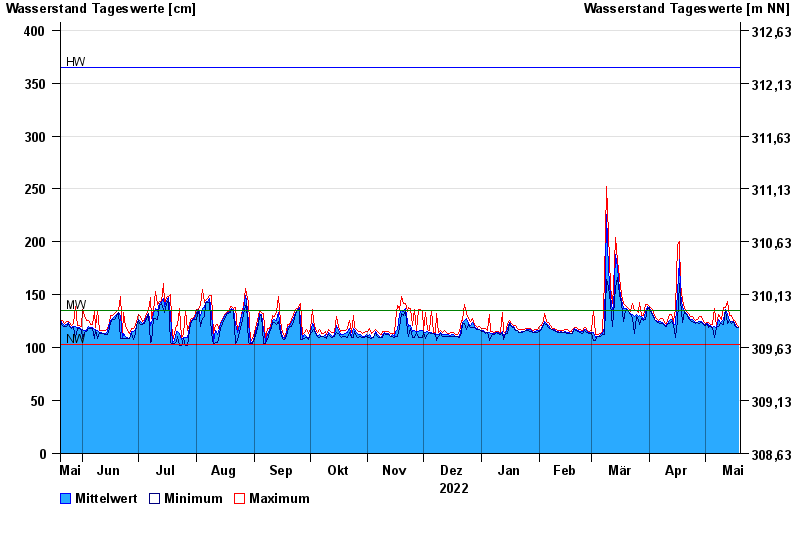
Hinweis
Wasserstand und Abfluss wird zeitweise durch Biberdamm beeinflusst.
| Datum | Mittelwert [cm] | Maximum [cm] | Minimum [cm] |
|---|---|---|---|
| 19.05.2023 | 119 | 120 | 119 |
| 18.05.2023 | 120 | 122 | 119 |
| 17.05.2023 | 123 | 126 | 121 |
| 16.05.2023 | 125 | 126 | 125 |
| 15.05.2023 | 125 | 130 | 123 |
| 14.05.2023 | 126 | 130 | 126 |
| 13.05.2023 | 131 | 144 | 123 |
© Bayerisches Landesamt für Umwelt 2024