
- Startseite >
- Flüsse >
- Wasserstand >
- Regnitz >
- Erlangen >
- Jahresgrafik

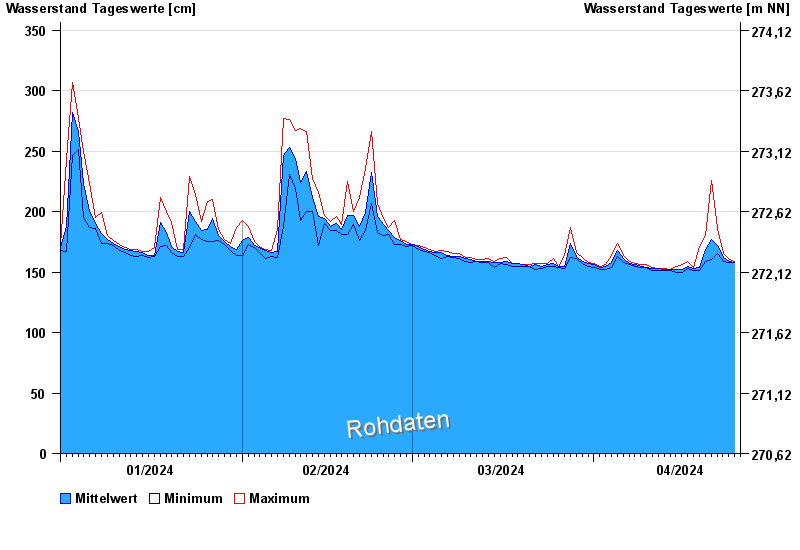
Jahresgrafik Erlangen / Schwabach
Wasserstand vom 01.01.2024 bis zum 25.04.2024
- 29.07.1941 Wasserstand: 524 cm
- 26.01.1995 Wasserstand: 481 cm
- 21.12.1993 Wasserstand: 445 cm
- 23.02.1970 Wasserstand: 443 cm
- 20.07.2011 Wasserstand: 438 cm
| Datum | Mittelwert [cm] | Maximum [cm] | Minimum [cm] |
|---|---|---|---|
| 25.04.2024 | 158 | 159 | 158 |
| 24.04.2024 | 159 | 160 | 158 |
| 23.04.2024 | 162 | 165 | 159 |
| 22.04.2024 | 172 | 186 | 165 |
| 21.04.2024 | 177 | 226 | 160 |
| 20.04.2024 | 169 | 180 | 159 |
| 19.04.2024 | 154 | 171 | 151 |
© Bayerisches Landesamt für Umwelt 2024