
- Startseite >
- Flüsse >
- Wasserstand >
- Regnitz >
- Büg >
- Jahresgrafik

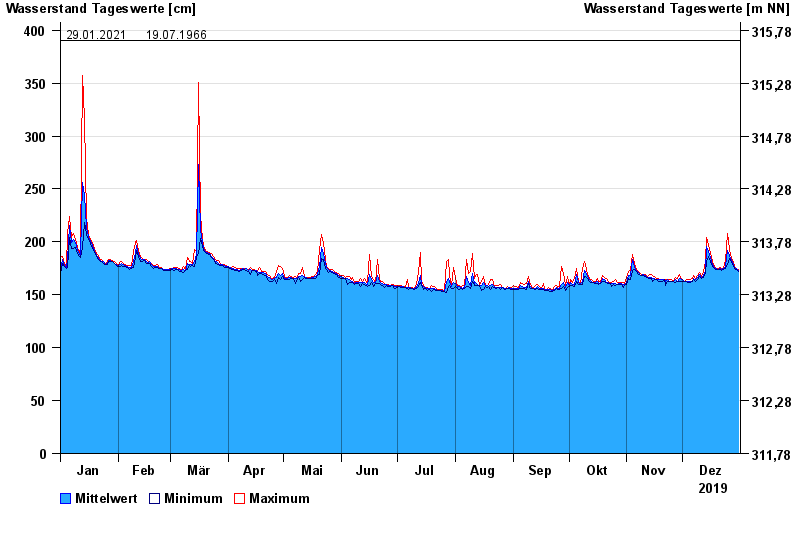
Jahresgrafik Büg / Schwabach
Wasserstand vom 01.01.2019 bis zum 31.12.2019
- 20.07.2011 Wasserstand: 409 cm
- 28.10.1998 Wasserstand: 404 cm
- 26.01.1995 Wasserstand: 401 cm
- 29.01.2021 Wasserstand: 390 cm
- 19.07.1966 Wasserstand: 390 cm
| Datum | Mittelwert [cm] | Maximum [cm] | Minimum [cm] |
|---|---|---|---|
| 31.12.2019 | 173 | 174 | 172 |
| 30.12.2019 | 175 | 175 | 174 |
| 29.12.2019 | 176 | 177 | 175 |
| 28.12.2019 | 179 | 181 | 177 |
| 27.12.2019 | 182 | 184 | 181 |
| 26.12.2019 | 187 | 193 | 184 |
| 25.12.2019 | 192 | 208 | 179 |
© Bayerisches Landesamt für Umwelt 2024