
- Startseite >
- Flüsse >
- Wasserstand >
- Regnitz >
- Aha >
- Jahresgrafik

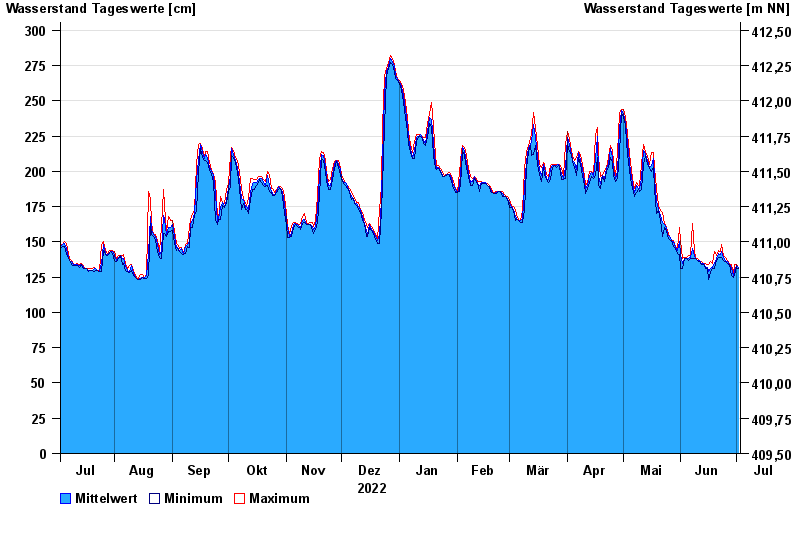
Jahresgrafik Aha / Altmühl
Wasserstand vom 03.07.2022 bis zum 02.07.2023
- 17.03.1988 Wasserstand: 379 cm
- 14.04.1994 Wasserstand: 373 cm
- 01.02.1982 Wasserstand: 373 cm
- 21.12.1993 Wasserstand: 371 cm
- 03.03.1987 Wasserstand: 361 cm
| Datum | Mittelwert [cm] | Maximum [cm] | Minimum [cm] |
|---|---|---|---|
| 02.07.2023 | 132 | 132 | 131 |
| 01.07.2023 | 133 | 134 | 132 |
| 30.06.2023 | 130 | 134 | 127 |
| 29.06.2023 | 126 | 127 | 125 |
| 28.06.2023 | 131 | 134 | 126 |
| 27.06.2023 | 134 | 135 | 134 |
| 26.06.2023 | 136 | 137 | 135 |
© Bayerisches Landesamt für Umwelt 2024