
- Startseite >
- Flüsse >
- Wasserstand >
- Untere Donau >
- Viechtach Reibenmühle >
- Jahresgrafik

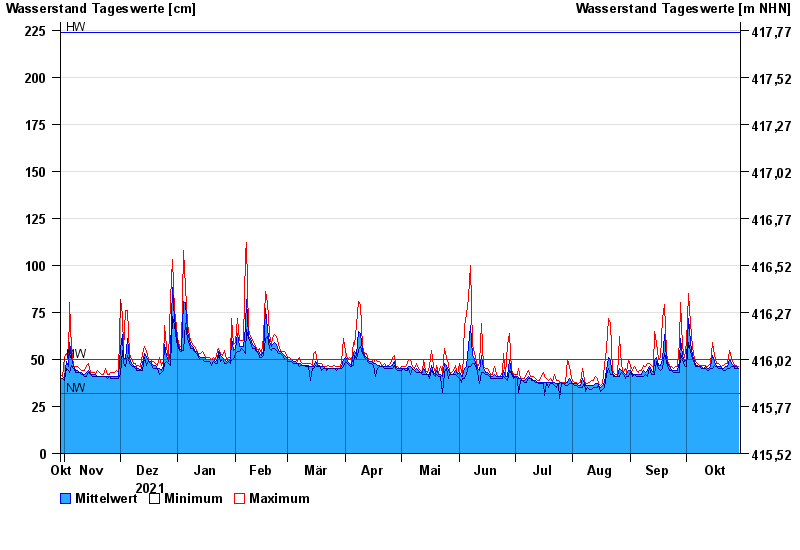
Jahresgrafik Viechtach Reibenmühle / Aitnach
Wasserstand vom 30.10.2021 bis zum 29.10.2022
| Datum | Mittelwert [cm] | Maximum [cm] | Minimum [cm] |
|---|---|---|---|
| 29.10.2022 | 45 | 46 | 45 |
| 28.10.2022 | 46 | 47 | 45 |
| 27.10.2022 | 46 | 47 | 45 |
| 26.10.2022 | 47 | 48 | 46 |
| 25.10.2022 | 48 | 51 | 46 |
| 24.10.2022 | 50 | 55 | 45 |
| 23.10.2022 | 46 | 48 | 45 |
© Bayerisches Landesamt für Umwelt 2024