
- Startseite >
- Flüsse >
- Wasserstand >
- Untere Donau >
- Viechtach Reibenmühle >
- Jahresgrafik

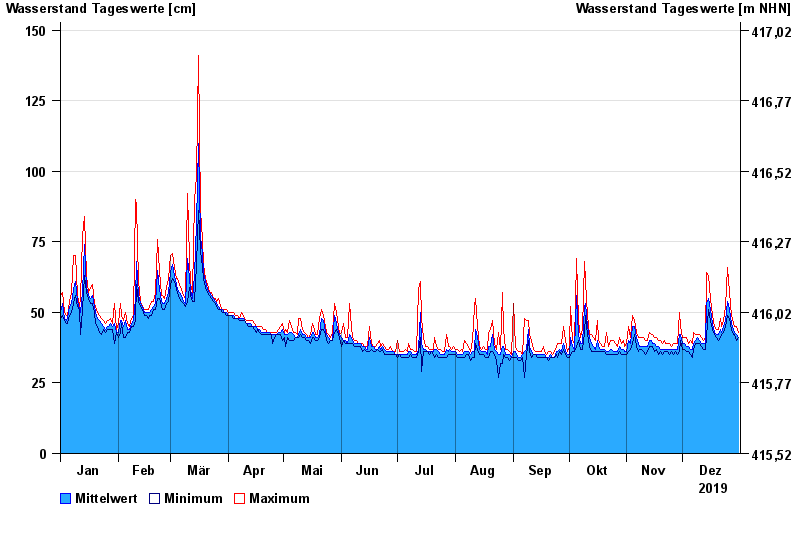
Jahresgrafik Viechtach Reibenmühle / Aitnach
Wasserstand vom 01.01.2019 bis zum 31.12.2019
 Für diesen Pegel sind keine Meldestufen hinterlegt.
| Datum | Mittelwert [cm] | Maximum [cm] | Minimum [cm] |
|---|---|---|---|
| 31.12.2019 | 41 | 43 | 41 |
| 30.12.2019 | 42 | 45 | 40 |
| 29.12.2019 | 43 | 45 | 42 |
| 28.12.2019 | 44 | 46 | 42 |
| 27.12.2019 | 46 | 49 | 44 |
| 26.12.2019 | 51 | 57 | 48 |
| 25.12.2019 | 54 | 66 | 49 |
© Bayerisches Landesamt für Umwelt 2024