
- Startseite >
- Flüsse >
- Wasserstand >
- Untere Donau >
- Schwandorf >
- Jahresgrafik

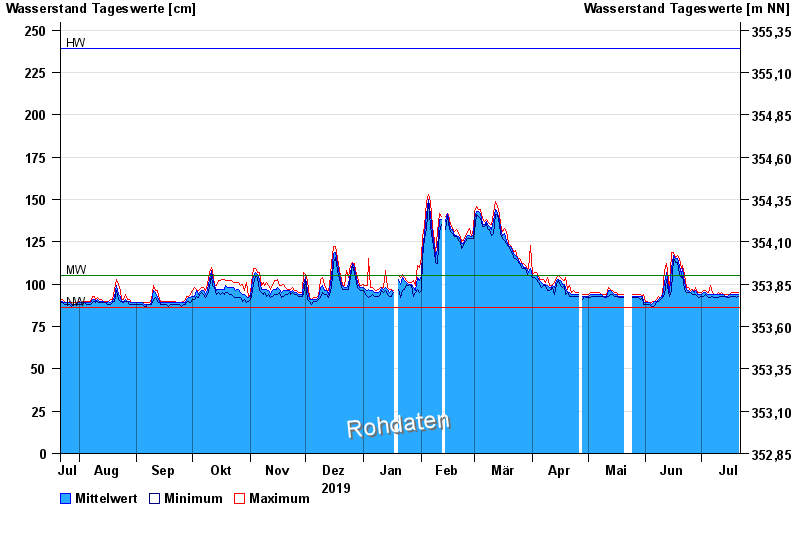
Jahresgrafik Schwandorf / Naab
Wasserstand vom 22.07.2019 bis zum 21.07.2020
Hinweis
Pegel bis auf Weiteres außer Betrieb wegen Brückenbauarbeiten.
| Datum | Mittelwert [cm] | Maximum [cm] | Minimum [cm] |
|---|---|---|---|
| 21.07.2020 | 94 | 95 | 93 |
| 20.07.2020 | 94 | 95 | 92 |
| 19.07.2020 | 94 | 95 | 93 |
| 18.07.2020 | 94 | 95 | 93 |
| 17.07.2020 | 94 | 95 | 93 |
| 16.07.2020 | 94 | 94 | 92 |
| 15.07.2020 | 93 | 94 | 92 |
© Bayerisches Landesamt für Umwelt 2024