
- Startseite >
- Flüsse >
- Wasserstand >
- Untere Donau >
- Sägmühle >
- Jahresgrafik

Jahresgrafik Sägmühle / Schwarzer Regen
Wasserstand vom 19.09.2021 bis zum 18.09.2022
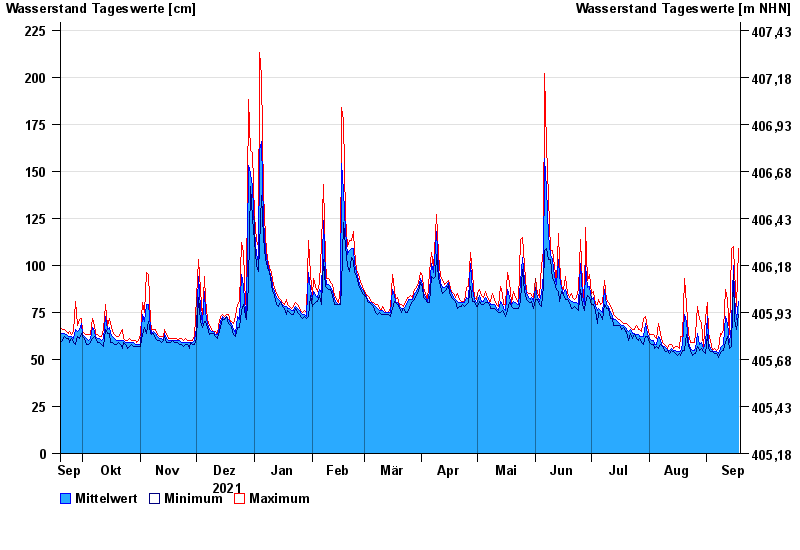
| Datum | Mittelwert [cm] | Maximum [cm] | Minimum [cm] |
|---|---|---|---|
| 18.09.2022 | 81 | 109 | 74 |
| 17.09.2022 | 71 | 78 | 66 |
| 16.09.2022 | 83 | 97 | 71 |
| 15.09.2022 | 100 | 110 | 95 |
| 14.09.2022 | 68 | 109 | 57 |
| 13.09.2022 | 59 | 63 | 56 |
| 12.09.2022 | 69 | 82 | 62 |
© Bayerisches Landesamt für Umwelt 2024