
- Startseite >
- Flüsse >
- Wasserstand >
- Untere Donau >
- Sägmühle >
- Jahresgrafik

Jahresgrafik Sägmühle / Schwarzer Regen
Wasserstand vom 06.12.2019 bis zum 05.12.2020
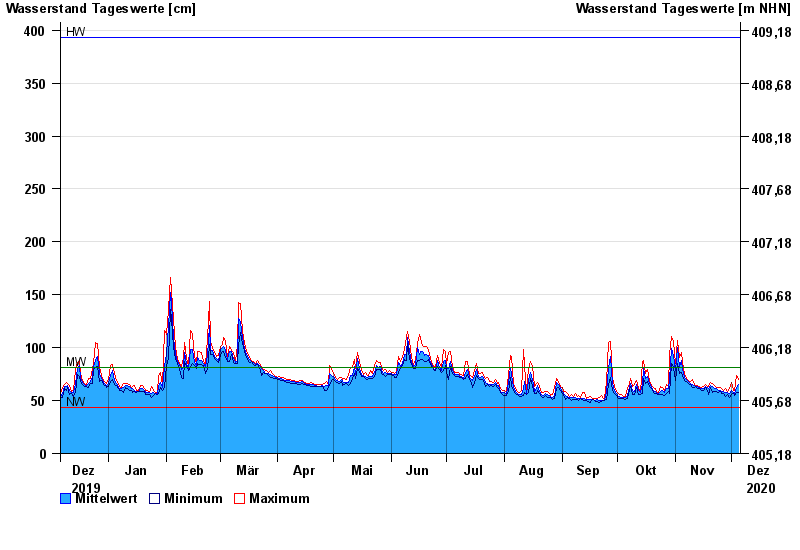
| Datum | Mittelwert [cm] | Maximum [cm] | Minimum [cm] |
|---|---|---|---|
| 05.12.2020 | 65 | 70 | 58 |
| 04.12.2020 | 62 | 74 | 58 |
| 03.12.2020 | 57 | 60 | 55 |
| 02.12.2020 | 58 | 60 | 57 |
| 01.12.2020 | 60 | 67 | 56 |
| 30.11.2020 | 57 | 61 | 53 |
| 29.11.2020 | 58 | 59 | 56 |
© Bayerisches Landesamt für Umwelt 2024