
- Startseite >
- Flüsse >
- Wasserstand >
- Untere Donau >
- Ruhstorf >
- Jahresgrafik

Jahresgrafik Ruhstorf / Rott
Wasserstand vom 01.01.2020 bis zum 31.12.2020
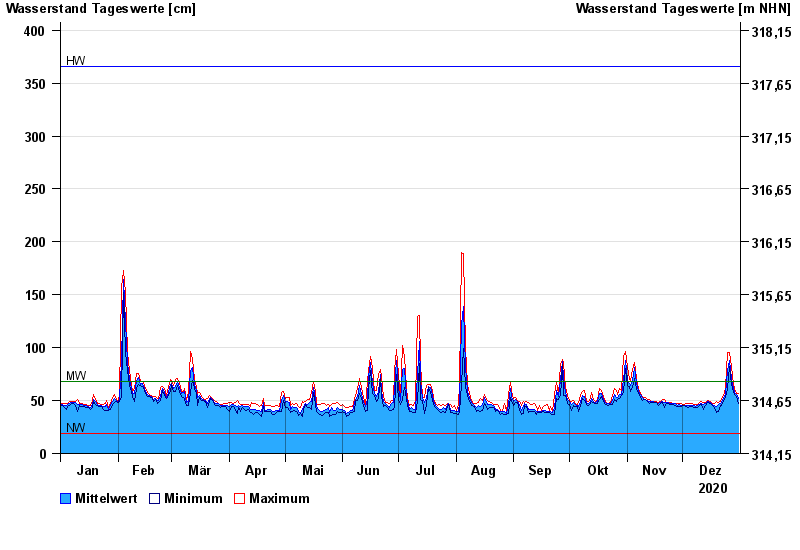
| Datum | Mittelwert [cm] | Maximum [cm] | Minimum [cm] |
|---|---|---|---|
| 31.12.2020 | 52 | 57 | 47 |
| 30.12.2020 | 56 | 57 | 54 |
| 29.12.2020 | 58 | 61 | 56 |
| 28.12.2020 | 61 | 65 | 58 |
| 27.12.2020 | 71 | 82 | 65 |
| 26.12.2020 | 88 | 95 | 82 |
| 25.12.2020 | 78 | 95 | 61 |
© Bayerisches Landesamt für Umwelt 2024