
- Startseite >
- Flüsse >
- Wasserstand >
- Untere Donau >
- Passau Ingling >
- Jahresgrafik

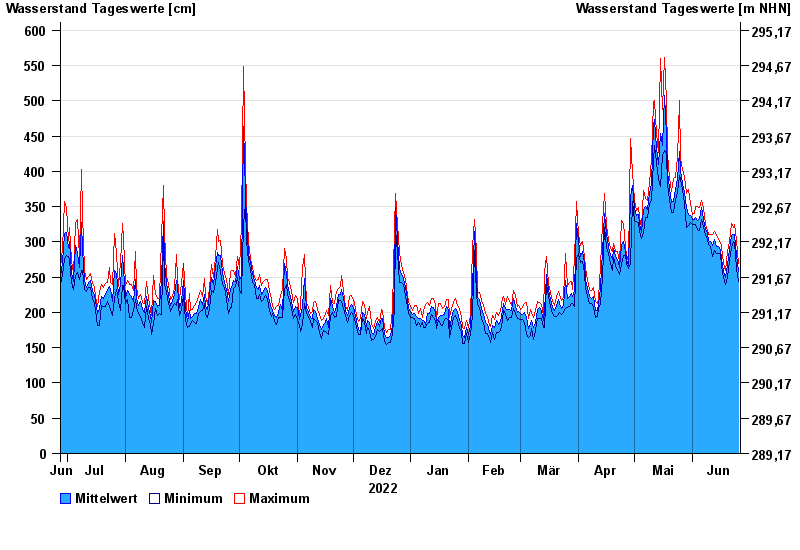
Jahresgrafik Passau Ingling / Inn
Wasserstand vom 27.06.2022 bis zum 26.06.2023
| Datum | Mittelwert [cm] | Maximum [cm] | Minimum [cm] |
|---|---|---|---|
| 26.06.2023 | 258 | 269 | 244 |
| 25.06.2023 | 280 | 302 | 262 |
| 24.06.2023 | 310 | 325 | 299 |
| 23.06.2023 | 311 | 321 | 301 |
| 22.06.2023 | 309 | 326 | 292 |
| 21.06.2023 | 289 | 300 | 274 |
| 20.06.2023 | 267 | 286 | 250 |
© Bayerisches Landesamt für Umwelt 2024