
- Startseite >
- Flüsse >
- Wasserstand >
- Untere Donau >
- Mainburg >
- Jahresgrafik

Jahresgrafik Mainburg / Abens
Wasserstand vom 01.01.2024 bis zum 24.04.2024
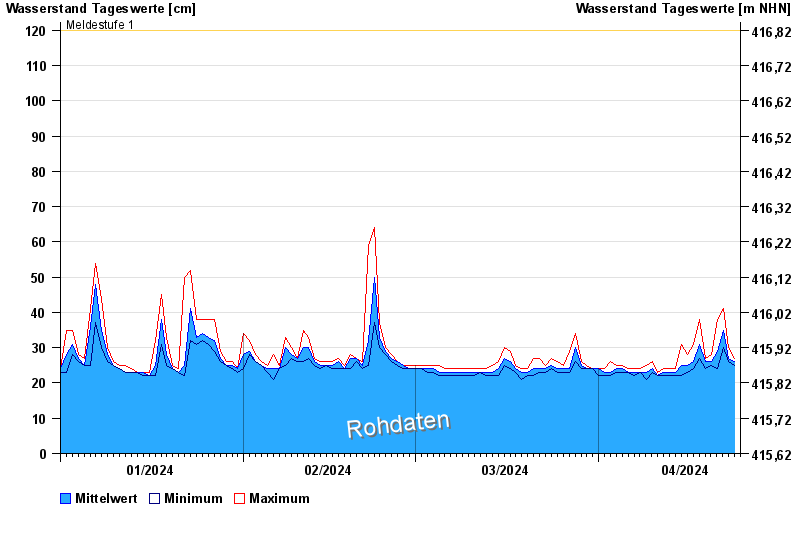
- Meldestufe 1 120 cm
- Meldestufe 3 160 cm
- Meldestufe 4 210 cm
- Hochwassergefahrenfläche HQ100 350 cm
| Datum | Mittelwert [cm] | Maximum [cm] | Minimum [cm] |
|---|---|---|---|
| 24.04.2024 | 26 | 26 | 26 |
| 23.04.2024 | 27 | 30 | 26 |
| 22.04.2024 | 35 | 41 | 30 |
| 21.04.2024 | 29 | 38 | 24 |
| 20.04.2024 | 26 | 28 | 25 |
| 19.04.2024 | 26 | 27 | 24 |
| 18.04.2024 | 31 | 38 | 27 |
© Bayerisches Landesamt für Umwelt 2024