
- Startseite >
- Flüsse >
- Wasserstand >
- Untere Donau >
- Grafenau >
- Jahresgrafik

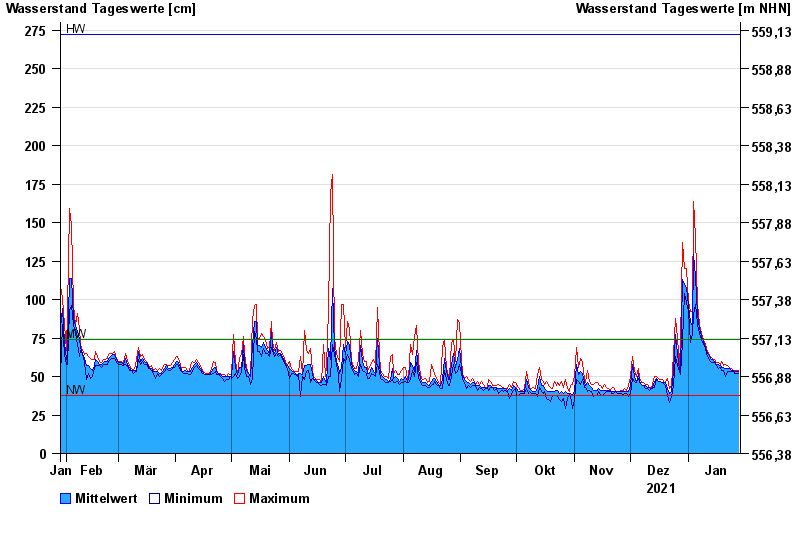
Jahresgrafik Grafenau / Kleine Ohe
Wasserstand vom 29.01.2021 bis zum 28.01.2022
| Datum | Mittelwert [cm] | Maximum [cm] | Minimum [cm] |
|---|---|---|---|
| 28.01.2022 | 53 | 54 | 52 |
| 27.01.2022 | 53 | 54 | 52 |
| 26.01.2022 | 53 | 54 | 52 |
| 25.01.2022 | 54 | 54 | 53 |
| 24.01.2022 | 54 | 55 | 53 |
| 23.01.2022 | 55 | 56 | 53 |
| 22.01.2022 | 55 | 57 | 53 |
© Bayerisches Landesamt für Umwelt 2024