
- Startseite >
- Flüsse >
- Wasserstand >
- Untere Donau >
- Grafenau >
- Jahresgrafik

Jahresgrafik Grafenau / Kleine Ohe
Wasserstand vom 24.04.2021 bis zum 23.04.2022
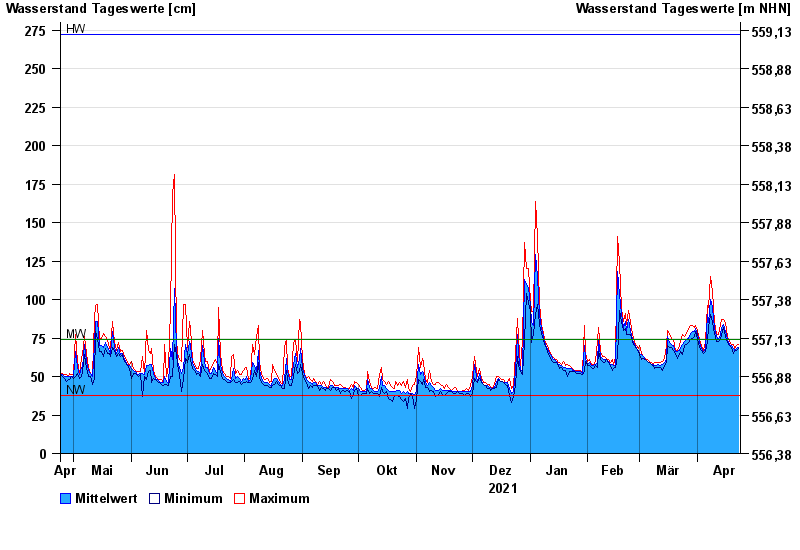
| Datum | Mittelwert [cm] | Maximum [cm] | Minimum [cm] |
|---|---|---|---|
| 23.04.2022 | 69 | 71 | 68 |
| 22.04.2022 | 68 | 70 | 67 |
| 21.04.2022 | 67 | 68 | 66 |
| 20.04.2022 | 68 | 71 | 65 |
| 19.04.2022 | 70 | 70 | 69 |
| 18.04.2022 | 71 | 73 | 70 |
| 17.04.2022 | 74 | 76 | 72 |
© Bayerisches Landesamt für Umwelt 2024