
- Startseite >
- Flüsse >
- Wasserstand >
- Untere Donau >
- Grafenau >
- Jahresgrafik

Jahresgrafik Grafenau / Kleine Ohe
Wasserstand vom 22.10.2019 bis zum 21.10.2020
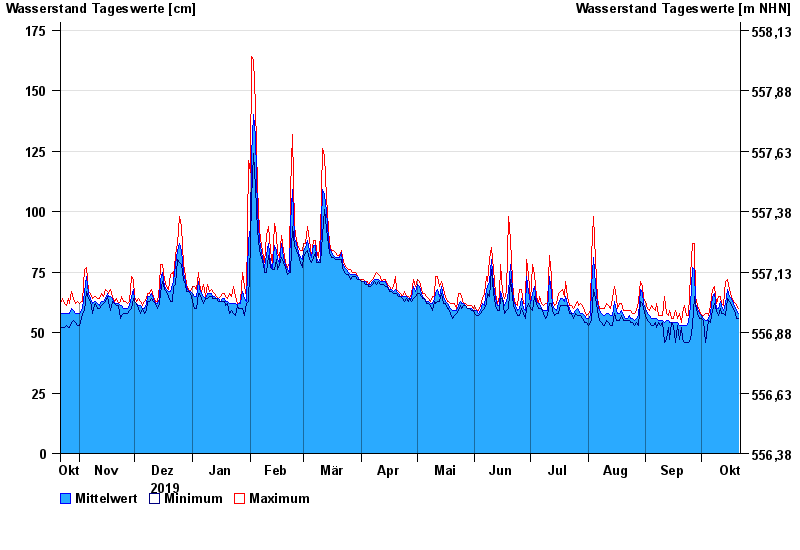
| Datum | Mittelwert [cm] | Maximum [cm] | Minimum [cm] |
|---|---|---|---|
| 21.10.2020 | 58 | 60 | 56 |
| 20.10.2020 | 59 | 61 | 56 |
| 19.10.2020 | 60 | 62 | 58 |
| 18.10.2020 | 62 | 63 | 60 |
| 17.10.2020 | 64 | 65 | 61 |
| 16.10.2020 | 65 | 68 | 63 |
| 15.10.2020 | 68 | 72 | 64 |
© Bayerisches Landesamt für Umwelt 2024