
- Startseite >
- Flüsse >
- Wasserstand >
- Untere Donau >
- Grafenau >
- Jahresgrafik

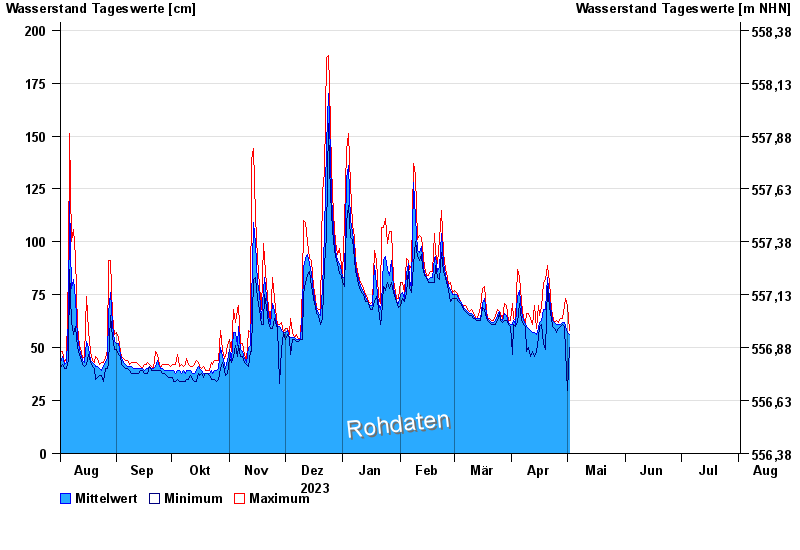
Jahresgrafik Grafenau / Kleine Ohe
Wasserstand vom 02.08.2023 bis zum 01.08.2024
| Datum | Mittelwert [cm] | Maximum [cm] | Minimum [cm] |
|---|---|---|---|
| 20.04.2024 | 80 | 80 | 79 |
| 19.04.2024 | 68 | 82 | 49 |
| 18.04.2024 | 68 | 81 | 52 |
| 17.04.2024 | 63 | 69 | 61 |
| 16.04.2024 | 62 | 65 | 60 |
| 15.04.2024 | 59 | 70 | 55 |
| 14.04.2024 | 56 | 59 | 48 |
© Bayerisches Landesamt für Umwelt 2024