
- Startseite >
- Flüsse >
- Wasserstand >
- Untere Donau >
- Grafenau >
- Jahresgrafik

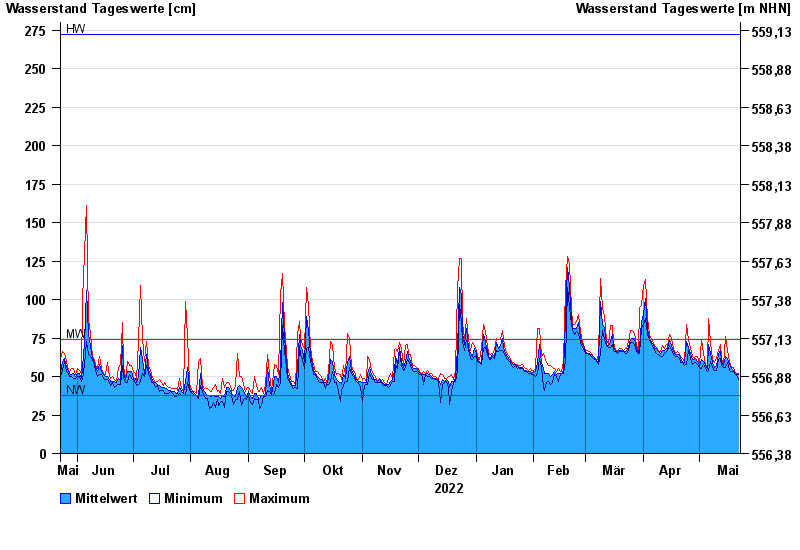
Jahresgrafik Grafenau / Kleine Ohe
Wasserstand vom 23.05.2022 bis zum 22.05.2023
| Datum | Mittelwert [cm] | Maximum [cm] | Minimum [cm] |
|---|---|---|---|
| 22.05.2023 | 51 | 52 | 48 |
| 21.05.2023 | 52 | 52 | 51 |
| 20.05.2023 | 53 | 53 | 52 |
| 19.05.2023 | 54 | 56 | 53 |
| 18.05.2023 | 55 | 56 | 53 |
| 17.05.2023 | 58 | 60 | 54 |
| 16.05.2023 | 62 | 67 | 59 |
© Bayerisches Landesamt für Umwelt 2024