
- Startseite >
- Flüsse >
- Wasserstand >
- Untere Donau >
- Grafenau >
- Jahresgrafik

Jahresgrafik Grafenau / Kleine Ohe
Wasserstand vom 02.08.2022 bis zum 01.08.2023
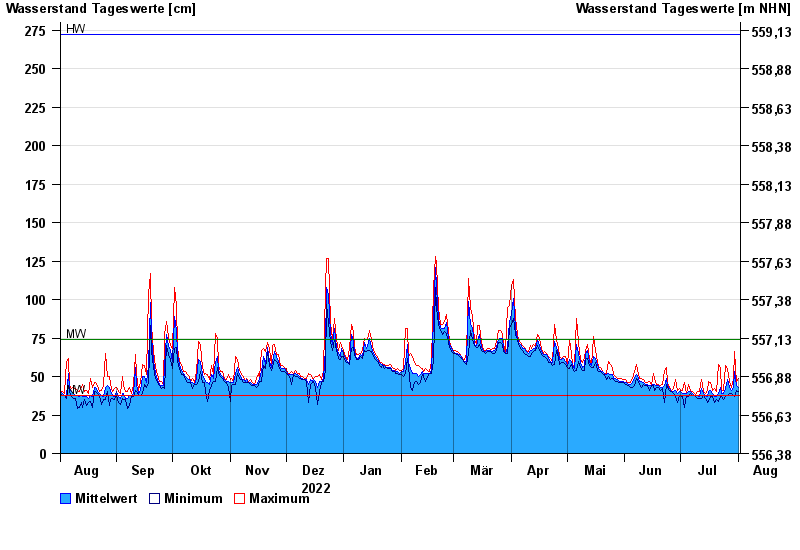
| Datum | Mittelwert [cm] | Maximum [cm] | Minimum [cm] |
|---|---|---|---|
| 01.08.2023 | 43 | 49 | 40 |
| 31.07.2023 | 44 | 46 | 41 |
| 30.07.2023 | 53 | 66 | 37 |
| 29.07.2023 | 43 | 48 | 38 |
| 28.07.2023 | 41 | 43 | 39 |
| 27.07.2023 | 43 | 47 | 39 |
| 26.07.2023 | 48 | 55 | 38 |
© Bayerisches Landesamt für Umwelt 2024