
- Startseite >
- Flüsse >
- Wasserstand >
- Untere Donau >
- Grafenau >
- Jahresgrafik

Jahresgrafik Grafenau / Kleine Ohe
Wasserstand vom 02.08.2023 bis zum 01.08.2024
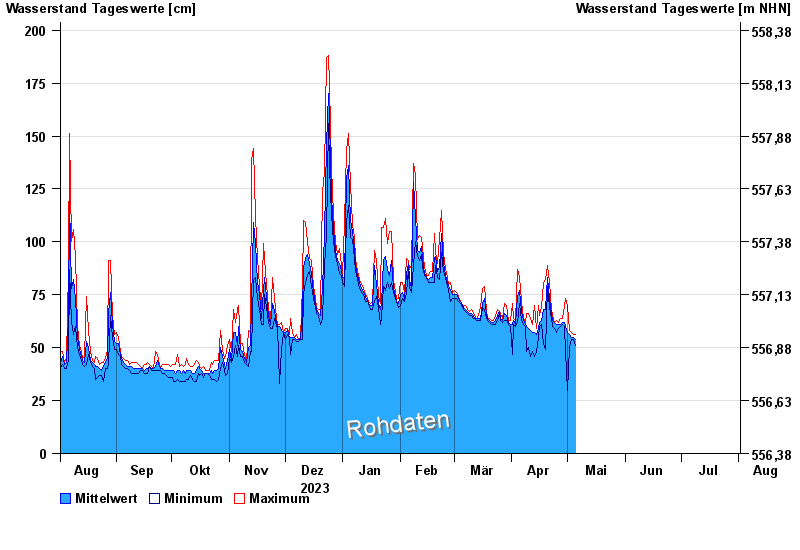
- Hochwassergefahrenfläche HQ100 270 cm
| Datum | Mittelwert [cm] | Maximum [cm] | Minimum [cm] |
|---|---|---|---|
| 24.04.2024 | 62 | 62 | 61 |
| 23.04.2024 | 63 | 65 | 60 |
| 22.04.2024 | 66 | 68 | 64 |
| 21.04.2024 | 73 | 81 | 69 |
| 20.04.2024 | 83 | 89 | 79 |
| 19.04.2024 | 68 | 82 | 49 |
| 18.04.2024 | 68 | 81 | 52 |
© Bayerisches Landesamt für Umwelt 2024