
- Startseite >
- Flüsse >
- Wasserstand >
- Naab - Regen >
- Weiden >
- Jahresgrafik

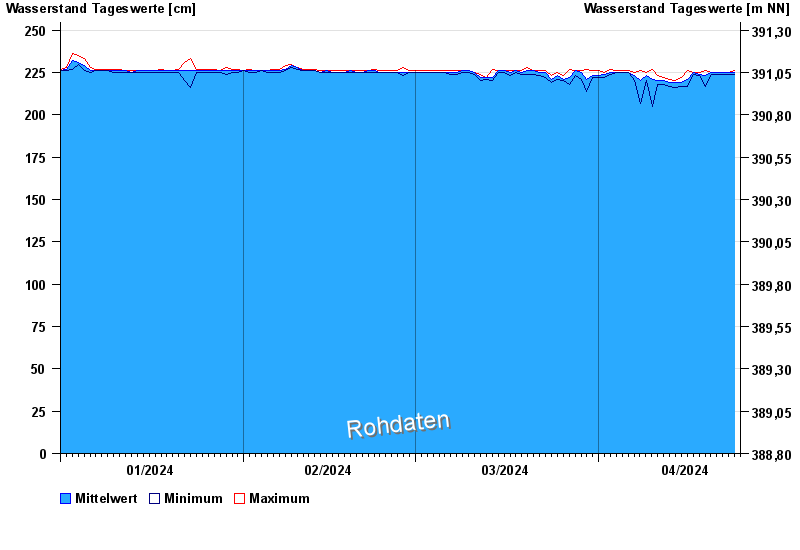
Jahresgrafik Weiden / Waldnaab
Wasserstand vom 01.01.2024 bis zum 24.04.2024
 Für diesen Pegel sind keine historische Ereignisse hinterlegt.
| Datum | Mittelwert [cm] | Maximum [cm] | Minimum [cm] |
|---|---|---|---|
| 24.04.2024 | 225 | 225 | 224 |
| 23.04.2024 | 225 | 225 | 224 |
| 22.04.2024 | 225 | 225 | 224 |
| 21.04.2024 | 225 | 225 | 224 |
| 20.04.2024 | 225 | 225 | 224 |
| 19.04.2024 | 223 | 226 | 217 |
| 18.04.2024 | 224 | 225 | 223 |
© Bayerisches Landesamt für Umwelt 2024