
- Startseite >
- Flüsse >
- Wasserstand >
- Naab - Regen >
- Untersteinach >
- Jahresgrafik

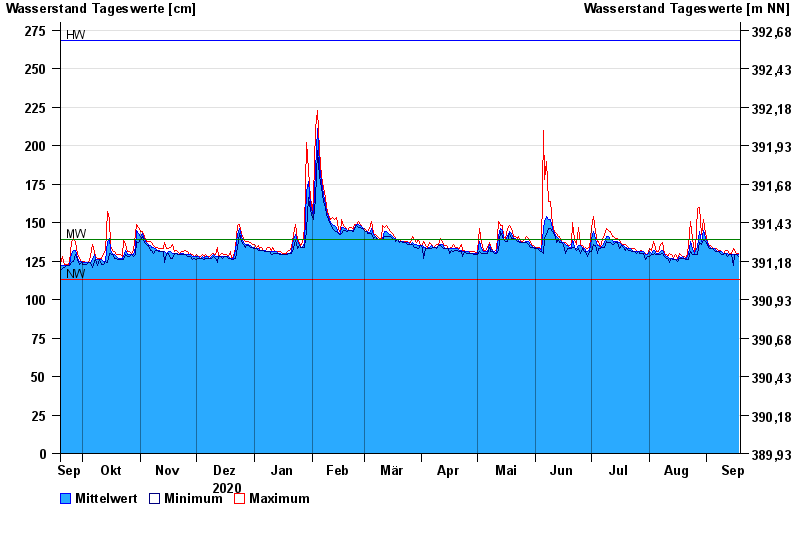
Jahresgrafik Untersteinach / Warme Steinach
Wasserstand vom 19.09.2020 bis zum 18.09.2021
| Datum | Mittelwert [cm] | Maximum [cm] | Minimum [cm] |
|---|---|---|---|
| 18.09.2021 | 129 | 130 | 128 |
| 17.09.2021 | 129 | 130 | 129 |
| 16.09.2021 | 129 | 132 | 129 |
| 15.09.2021 | 129 | 133 | 122 |
| 14.09.2021 | 129 | 130 | 129 |
| 13.09.2021 | 129 | 130 | 129 |
| 12.09.2021 | 130 | 132 | 128 |
© Bayerisches Landesamt für Umwelt 2024