
- Startseite >
- Flüsse >
- Wasserstand >
- Naab - Regen >
- Schwandorf >
- Jahresgrafik

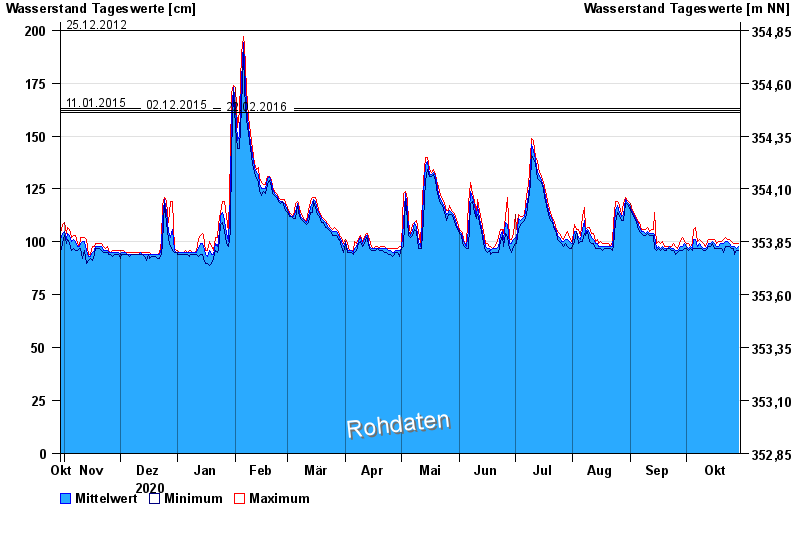
Jahresgrafik Schwandorf / Naab
Wasserstand vom 30.10.2020 bis zum 29.10.2021
Hinweis
Pegel bis auf Weiteres außer Betrieb wegen Brückenbauarbeiten.
- 04.06.2013 Wasserstand: 239 cm
- 25.12.2012 Wasserstand: 200 cm
- 11.01.2015 Wasserstand: 163 cm
- 02.12.2015 Wasserstand: 162 cm
- 22.02.2016 Wasserstand: 161 cm
| Datum | Mittelwert [cm] | Maximum [cm] | Minimum [cm] |
|---|---|---|---|
| 29.10.2021 | 98 | 99 | 96 |
| 28.10.2021 | 97 | 99 | 96 |
| 27.10.2021 | 98 | 99 | 94 |
| 26.10.2021 | 98 | 99 | 97 |
| 25.10.2021 | 98 | 100 | 97 |
| 24.10.2021 | 99 | 101 | 98 |
| 23.10.2021 | 100 | 101 | 98 |
© Bayerisches Landesamt für Umwelt 2024