
- Startseite >
- Flüsse >
- Wasserstand >
- Naab - Regen >
- Schwandorf >
- Jahresgrafik

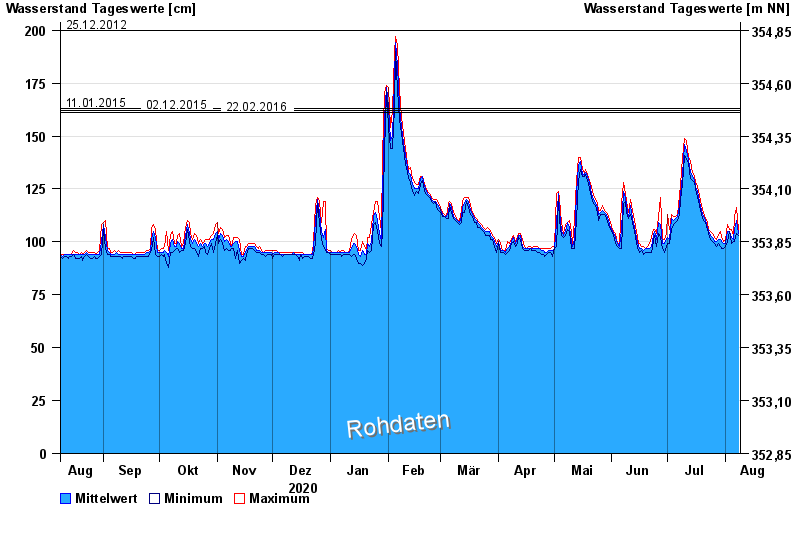
Jahresgrafik Schwandorf / Naab
Wasserstand vom 09.08.2020 bis zum 08.08.2021
Hinweis
Pegel bis auf Weiteres außer Betrieb wegen Brückenbauarbeiten.
- 04.06.2013 Wasserstand: 239 cm
- 25.12.2012 Wasserstand: 200 cm
- 11.01.2015 Wasserstand: 163 cm
- 02.12.2015 Wasserstand: 162 cm
- 22.02.2016 Wasserstand: 161 cm
| Datum | Mittelwert [cm] | Maximum [cm] | Minimum [cm] |
|---|---|---|---|
| 08.08.2021 | 104 | 106 | 103 |
| 07.08.2021 | 110 | 116 | 104 |
| 06.08.2021 | 106 | 112 | 100 |
| 05.08.2021 | 101 | 103 | 100 |
| 04.08.2021 | 102 | 106 | 99 |
| 03.08.2021 | 105 | 106 | 105 |
| 02.08.2021 | 105 | 108 | 100 |
© Bayerisches Landesamt für Umwelt 2024