
- Startseite >
- Flüsse >
- Wasserstand >
- Naab - Regen >
- Schwabelweis >
- Jahresgrafik

Jahresgrafik Schwabelweis / Donau
Wasserstand vom 22.01.2020 bis zum 21.01.2021
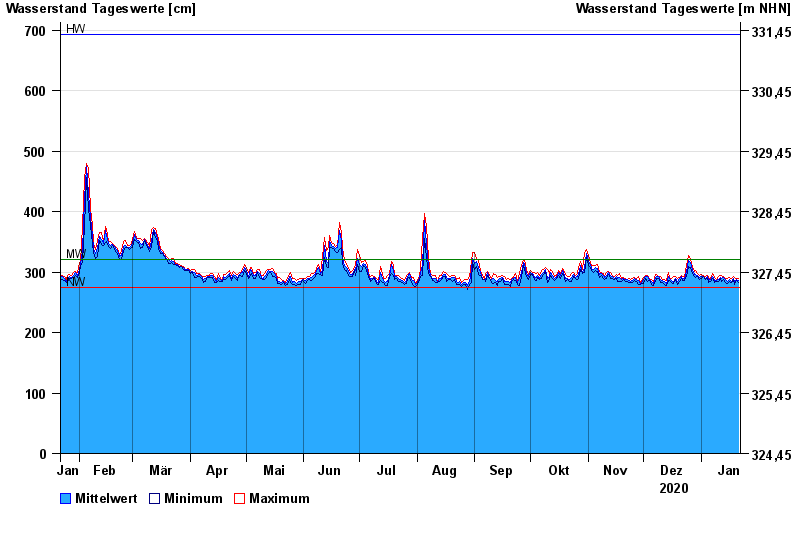
| Datum | Mittelwert [cm] | Maximum [cm] | Minimum [cm] |
|---|---|---|---|
| 21.01.2021 | 286 | 289 | 283 |
| 20.01.2021 | 287 | 290 | 286 |
| 19.01.2021 | 284 | 291 | 280 |
| 18.01.2021 | 289 | 292 | 287 |
| 17.01.2021 | 285 | 289 | 282 |
| 16.01.2021 | 288 | 291 | 285 |
| 15.01.2021 | 285 | 290 | 281 |
© Bayerisches Landesamt für Umwelt 2024