
- Startseite >
- Flüsse >
- Wasserstand >
- Naab - Regen >
- Pulling >
- Jahresgrafik

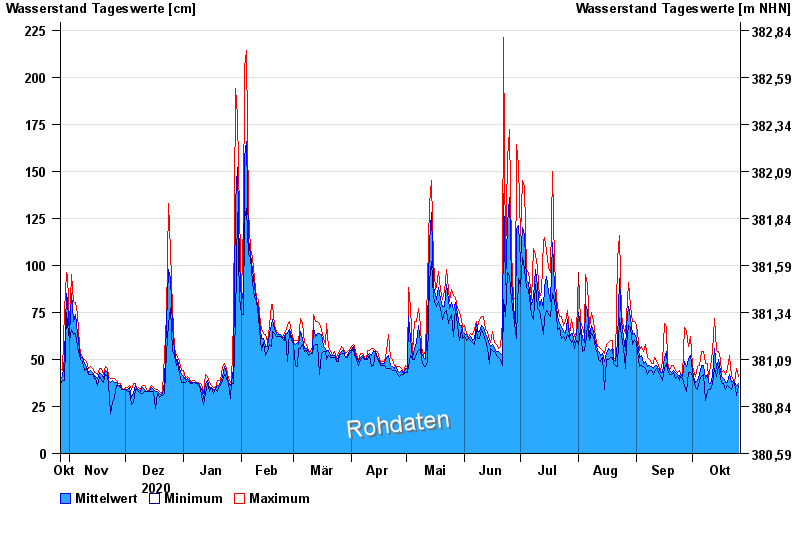
Jahresgrafik Pulling / Regen
Wasserstand vom 27.10.2020 bis zum 26.10.2021
| Datum | Mittelwert [cm] | Maximum [cm] | Minimum [cm] |
|---|---|---|---|
| 26.10.2021 | 37 | 41 | 36 |
| 25.10.2021 | 36 | 45 | 31 |
| 24.10.2021 | 38 | 38 | 37 |
| 23.10.2021 | 39 | 39 | 38 |
| 22.10.2021 | 38 | 41 | 34 |
| 21.10.2021 | 42 | 52 | 35 |
| 20.10.2021 | 38 | 45 | 36 |
© Bayerisches Landesamt für Umwelt 2024