
- Startseite >
- Flüsse >
- Wasserstand >
- Naab - Regen >
- Pulling >
- Jahresgrafik

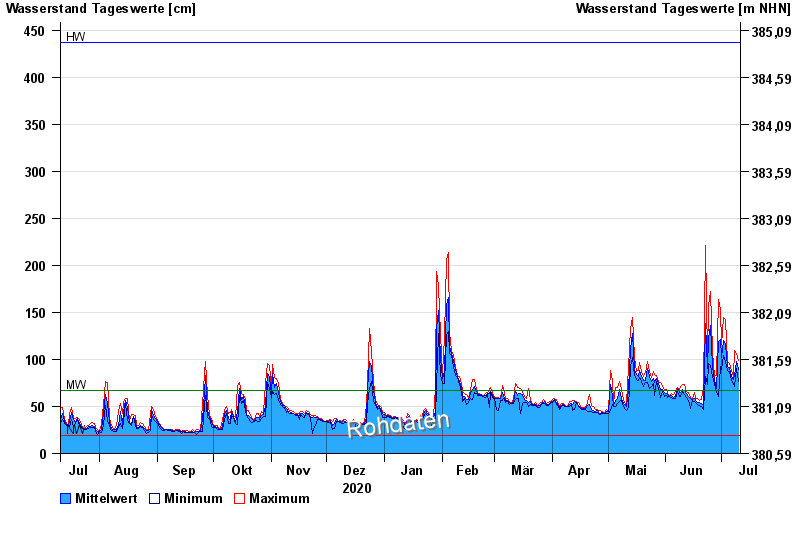
Jahresgrafik Pulling / Regen
Wasserstand vom 11.07.2020 bis zum 10.07.2021
| Datum | Mittelwert [cm] | Maximum [cm] | Minimum [cm] |
|---|---|---|---|
| 10.07.2021 | 89 | 99 | 77 |
| 09.07.2021 | 98 | 106 | 90 |
| 08.07.2021 | 83 | 109 | 71 |
| 07.07.2021 | 79 | 82 | 74 |
| 06.07.2021 | 82 | 88 | 78 |
| 05.07.2021 | 91 | 96 | 87 |
| 04.07.2021 | 92 | 98 | 88 |
© Bayerisches Landesamt für Umwelt 2024