
- Startseite >
- Flüsse >
- Wasserstand >
- Naab - Regen >
- Pulling >
- Jahresgrafik

Jahresgrafik Pulling / Regen
Wasserstand vom 01.01.2022 bis zum 31.12.2022
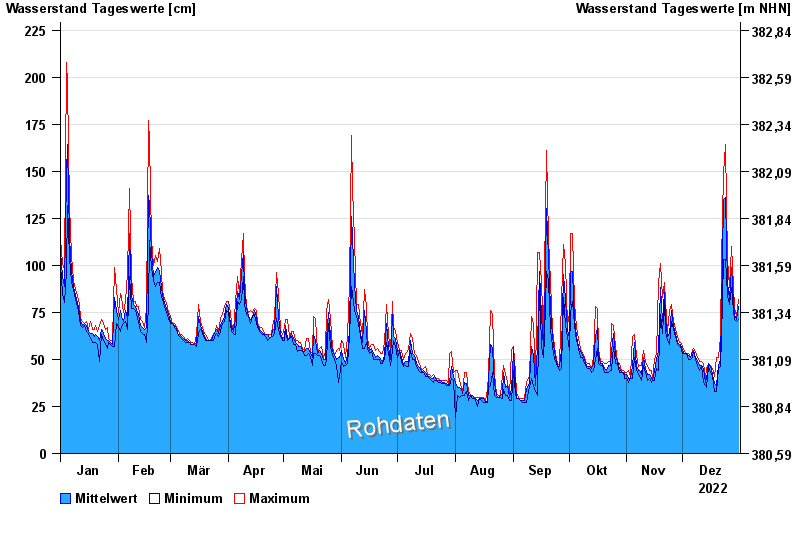
| Datum | Mittelwert [cm] | Maximum [cm] | Minimum [cm] |
|---|---|---|---|
| 31.12.2022 | 78 | 82 | 71 |
| 30.12.2022 | 71 | 73 | 70 |
| 29.12.2022 | 74 | 77 | 71 |
| 28.12.2022 | 80 | 89 | 76 |
| 27.12.2022 | 99 | 110 | 88 |
| 26.12.2022 | 82 | 88 | 79 |
| 25.12.2022 | 91 | 103 | 84 |
© Bayerisches Landesamt für Umwelt 2024