
- Startseite >
- Flüsse >
- Wasserstand >
- Naab - Regen >
- Pulling >
- Jahresgrafik

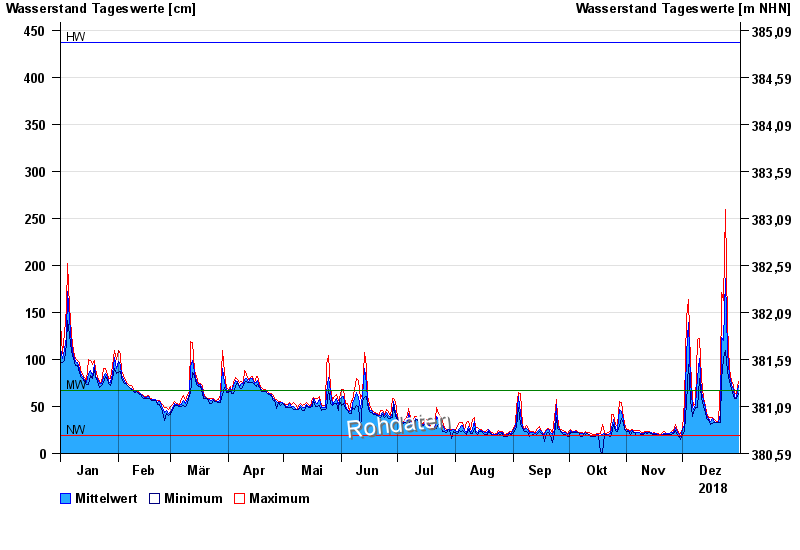
Jahresgrafik Pulling / Regen
Wasserstand vom 01.01.2018 bis zum 31.12.2018
| Datum | Mittelwert [cm] | Maximum [cm] | Minimum [cm] |
|---|---|---|---|
| 31.12.2018 | 72 | 77 | 64 |
| 30.12.2018 | 60 | 64 | 58 |
| 29.12.2018 | 61 | 64 | 58 |
| 28.12.2018 | 68 | 72 | 62 |
| 27.12.2018 | 73 | 78 | 68 |
| 26.12.2018 | 82 | 89 | 77 |
| 25.12.2018 | 108 | 136 | 87 |
© Bayerisches Landesamt für Umwelt 2024