
- Startseite >
- Flüsse >
- Wasserstand >
- Naab - Regen >
- Pulling >
- Jahresgrafik

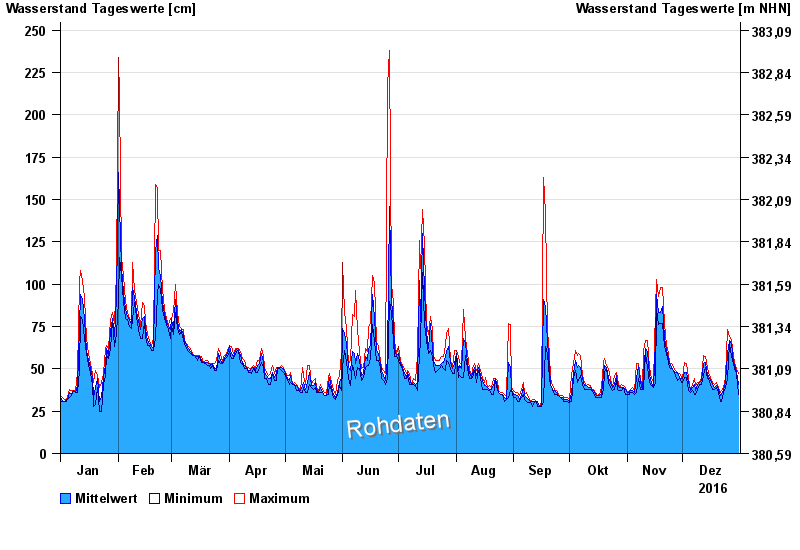
Jahresgrafik Pulling / Regen
Wasserstand vom 01.01.2016 bis zum 31.12.2016
| Datum | Mittelwert [cm] | Maximum [cm] | Minimum [cm] |
|---|---|---|---|
| 31.12.2016 | 41 | 47 | 35 |
| 30.12.2016 | 48 | 50 | 47 |
| 29.12.2016 | 53 | 54 | 50 |
| 28.12.2016 | 54 | 57 | 53 |
| 27.12.2016 | 65 | 67 | 57 |
| 26.12.2016 | 67 | 69 | 65 |
| 25.12.2016 | 59 | 73 | 44 |
© Bayerisches Landesamt für Umwelt 2024