
- Startseite >
- Flüsse >
- Wasserstand >
- Naab - Regen >
- Plattling >
- Jahresgrafik

Jahresgrafik Plattling / Isar
Wasserstand vom 29.03.2021 bis zum 28.03.2022
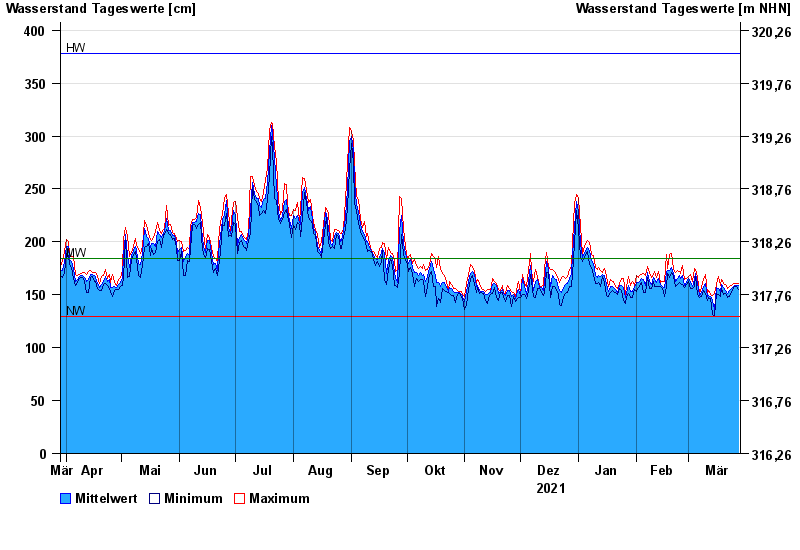
| Datum | Mittelwert [cm] | Maximum [cm] | Minimum [cm] |
|---|---|---|---|
| 28.03.2022 | 159 | 161 | 155 |
| 27.03.2022 | 159 | 161 | 158 |
| 26.03.2022 | 159 | 161 | 158 |
| 25.03.2022 | 158 | 161 | 156 |
| 24.03.2022 | 156 | 159 | 153 |
| 23.03.2022 | 154 | 158 | 148 |
| 22.03.2022 | 151 | 156 | 147 |
© Bayerisches Landesamt für Umwelt 2024