
- Startseite >
- Flüsse >
- Wasserstand >
- Naab - Regen >
- Plattling >
- Jahresgrafik

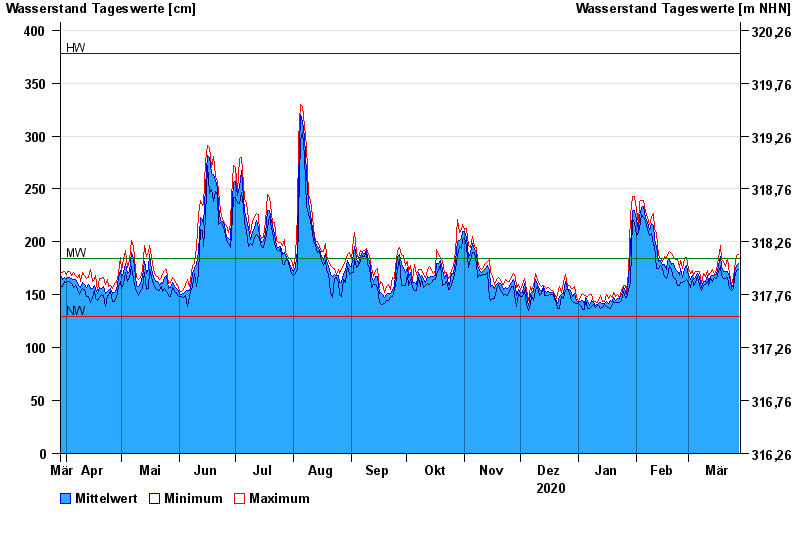
Jahresgrafik Plattling / Isar
Wasserstand vom 29.03.2020 bis zum 28.03.2021
| Datum | Mittelwert [cm] | Maximum [cm] | Minimum [cm] |
|---|---|---|---|
| 28.03.2021 | 180 | 188 | 174 |
| 27.03.2021 | 178 | 187 | 173 |
| 26.03.2021 | 172 | 175 | 165 |
| 25.03.2021 | 161 | 166 | 156 |
| 24.03.2021 | 156 | 159 | 154 |
| 23.03.2021 | 167 | 170 | 156 |
| 22.03.2021 | 172 | 184 | 166 |
© Bayerisches Landesamt für Umwelt 2024