
- Startseite >
- Flüsse >
- Wasserstand >
- Naab - Regen >
- Langenbruck >
- Jahresgrafik

Jahresgrafik Langenbruck / Frankenohe
Wasserstand vom 12.04.2022 bis zum 11.04.2023
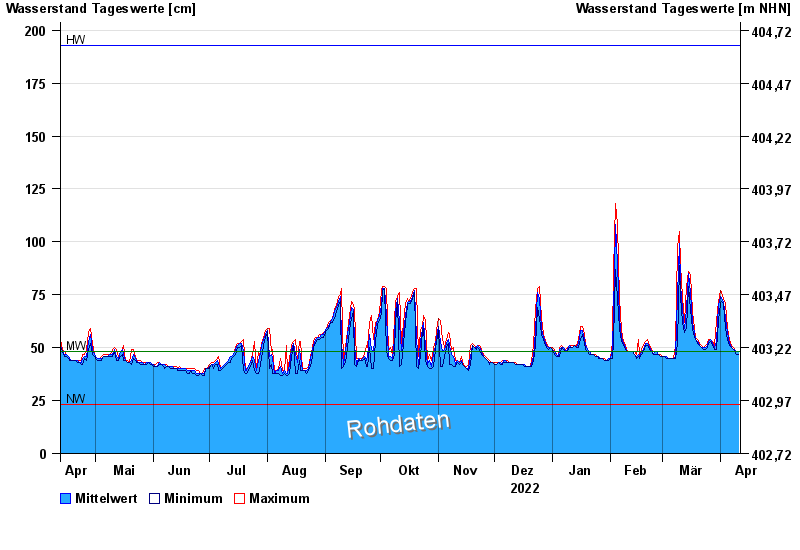
| Datum | Mittelwert [cm] | Maximum [cm] | Minimum [cm] |
|---|---|---|---|
| 11.04.2023 | 48 | 48 | 47 |
| 10.04.2023 | 48 | 48 | 47 |
| 09.04.2023 | 49 | 49 | 48 |
| 08.04.2023 | 49 | 50 | 49 |
| 07.04.2023 | 50 | 51 | 50 |
| 06.04.2023 | 52 | 54 | 51 |
| 05.04.2023 | 57 | 59 | 54 |
© Bayerisches Landesamt für Umwelt 2024