
- Startseite >
- Flüsse >
- Wasserstand >
- Naab - Regen >
- Langenbruck >
- Jahresgrafik

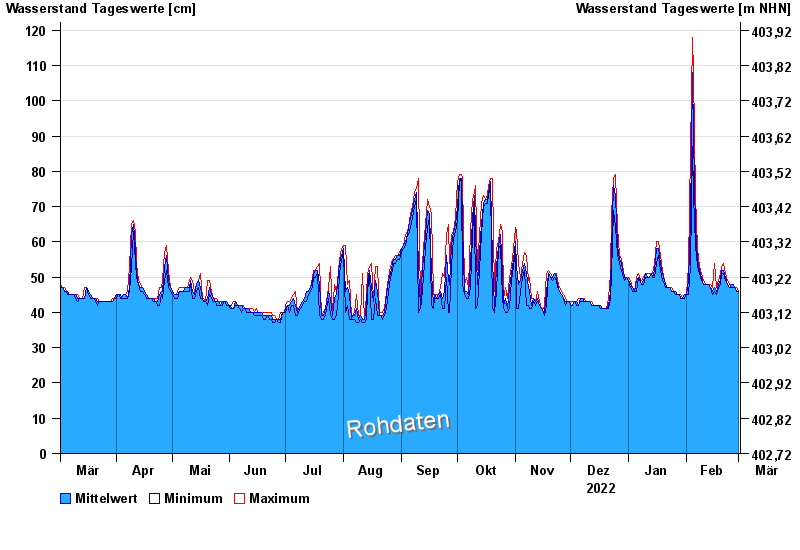
Jahresgrafik Langenbruck / Frankenohe
Wasserstand vom 02.03.2022 bis zum 01.03.2023
| Datum | Mittelwert [cm] | Maximum [cm] | Minimum [cm] |
|---|---|---|---|
| 01.03.2023 | 46 | 46 | 46 |
| 28.02.2023 | 46 | 47 | 46 |
| 27.02.2023 | 47 | 47 | 47 |
| 26.02.2023 | 48 | 48 | 47 |
| 25.02.2023 | 48 | 48 | 47 |
| 24.02.2023 | 47 | 48 | 47 |
| 23.02.2023 | 48 | 49 | 48 |
© Bayerisches Landesamt für Umwelt 2024